Answered step by step
Verified Expert Solution
Question
1 Approved Answer
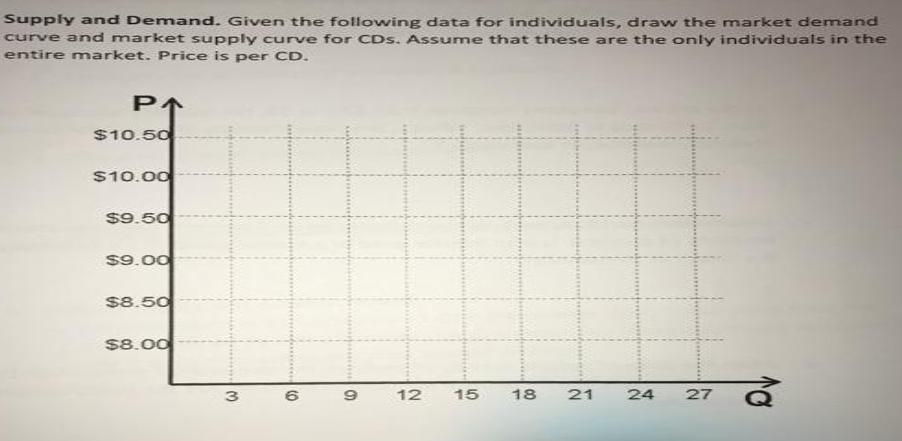
Supply and Demand. Given the following data for individuals, draw the market demand curve and market supply curve for CDs. Assume that these are


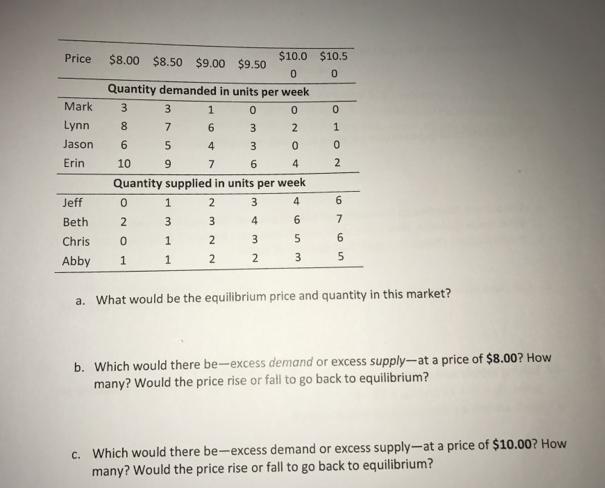
Supply and Demand. Given the following data for individuals, draw the market demand curve and market supply curve for CDs. Assume that these are the only individuals in the entire market. Price is per CD. $10.50 S10.00 $9.50 $9.00 $8.50 $8.00 12 15 18 21 24 27 3. Price $8.00 $8.50 $9.00 $9.50 $10.0 $10.5 Quantity demanded in units per week Mark 3 1 0. Lynn 8 7 6. 3 Jason 5. 4 Erin 10 9 7 4 Quantity supplied in units per week Jeff 2 3. 4. 6. Beth 3 6. 7. Chris 1 2 3 6. Abby 1 2 2 3 a. What would be the equilibrium price and quantity in this market? b. Which would there be-excess demand or excess supply-at a price of $8.00? How many? Would the price rise or fall to go back to equilibrium? c. Which would there be-excess demand or excess supply-at a price of $10.00? How many? Would the price rise or fall to go back to equilibrium? O102 NO LO
Step by Step Solution
★★★★★
3.48 Rating (161 Votes )
There are 3 Steps involved in it
Step: 1
Price Quantity demand units Quantity supply units 800 27 3 8 6 10 ...
Get Instant Access to Expert-Tailored Solutions
See step-by-step solutions with expert insights and AI powered tools for academic success
Step: 2

Step: 3

Ace Your Homework with AI
Get the answers you need in no time with our AI-driven, step-by-step assistance
Get Started


