

Answered step by step
Verified Expert Solution
Question
1 Approved Answer
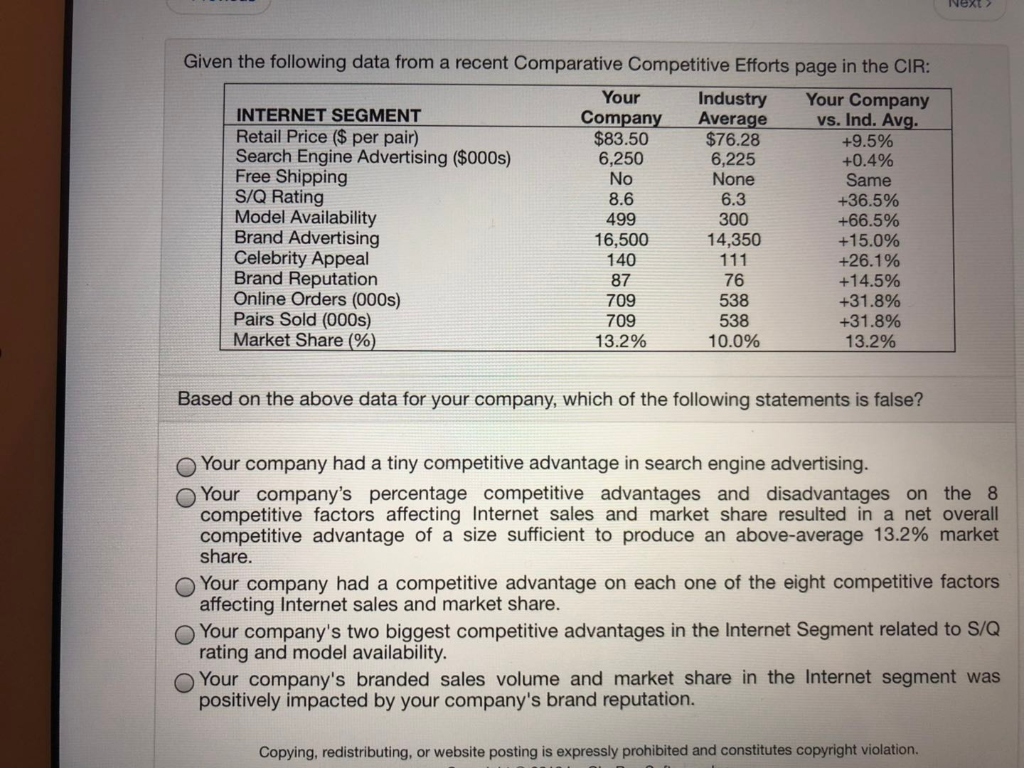
Given the following data from a recent Comparative Competitive Efforts page in the CIR: Your Industry Your Company Ind. Avg. INTERNET SEGMENT Retail Price ($
Step by Step Solution
There are 3 Steps involved in it
Step: 1

Get Instant Access to Expert-Tailored Solutions
See step-by-step solutions with expert insights and AI powered tools for academic success
Step: 2

Step: 3
Ace Your Homework with AI
Get the answers you need in no time with our AI-driven, step-by-step assistance
Get Started
Public Spending In The 20th Century A Global Perspective
Authors: Vito Tanzi , Ludger Schuknecht
1st Edition
0521662915,0511839596