Answered step by step
Verified Expert Solution
Question
1 Approved Answer
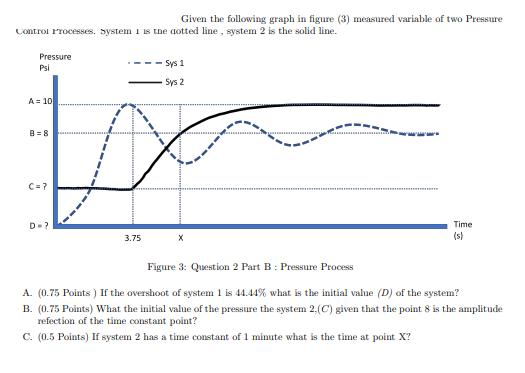
Given the following graph in figure (3) measured variable of two Pressure Control Processes, system i is the dotted line, system 2 is the

Given the following graph in figure (3) measured variable of two Pressure Control Processes, system i is the dotted line, system 2 is the solid line. Pressure Psi A= 10 B=8 C=? D=? 3.75 -Sys 1 Sys 2 X Time (s) Figure 3: Question 2 Part B: Pressure Process. A. (0.75 Points) If the overshoot of system 1 is 44.44% what is the initial value (D) of the system? B. (0.75 Points) What the initial value of the pressure the system 2. (C) given that the point 8 is the amplitude refection of the time constant point? C. (0.5 Points) If system 2 has a time constant of 1 minute what is the time at point X?
Step by Step Solution
★★★★★
3.45 Rating (171 Votes )
There are 3 Steps involved in it
Step: 1
A System 1 overshoot is 4444 of the initial value Overshoot 04444 Initial Value Over...
Get Instant Access to Expert-Tailored Solutions
See step-by-step solutions with expert insights and AI powered tools for academic success
Step: 2

Step: 3

Ace Your Homework with AI
Get the answers you need in no time with our AI-driven, step-by-step assistance
Get Started


