Answered step by step
Verified Expert Solution
Question
1 Approved Answer
Given the following graph in Figure B2, calculate the amount of the betweenness flow value for each edge regarding the node A. Please provide
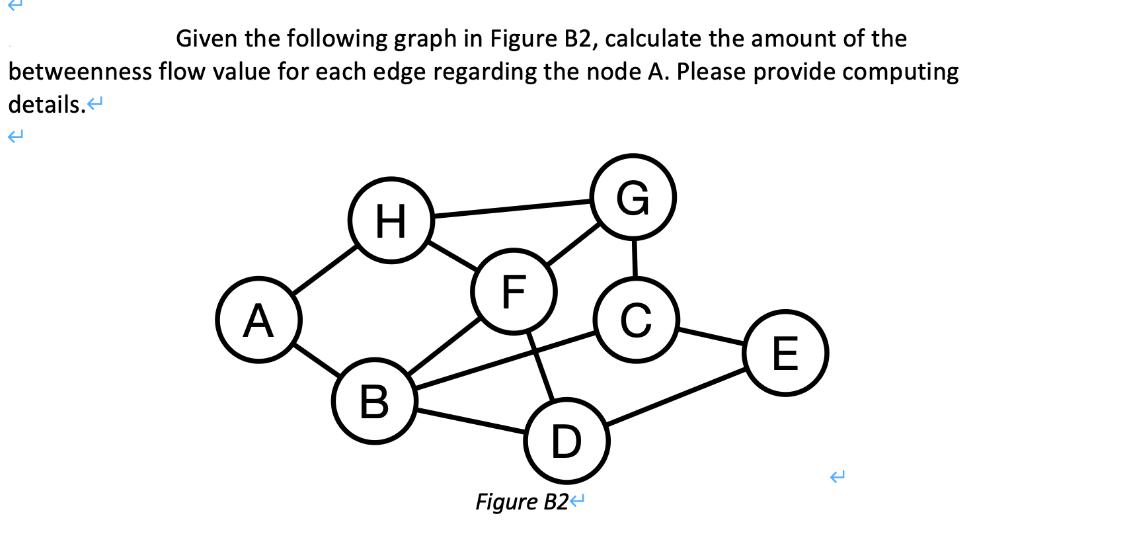
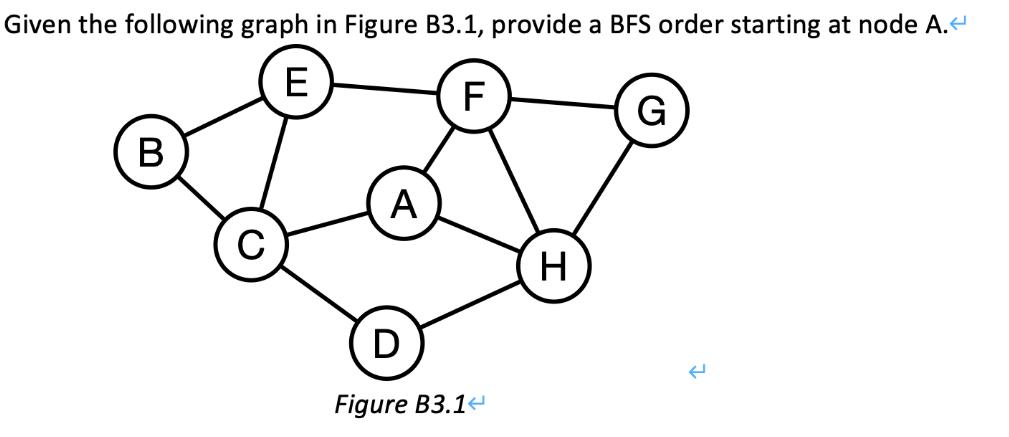
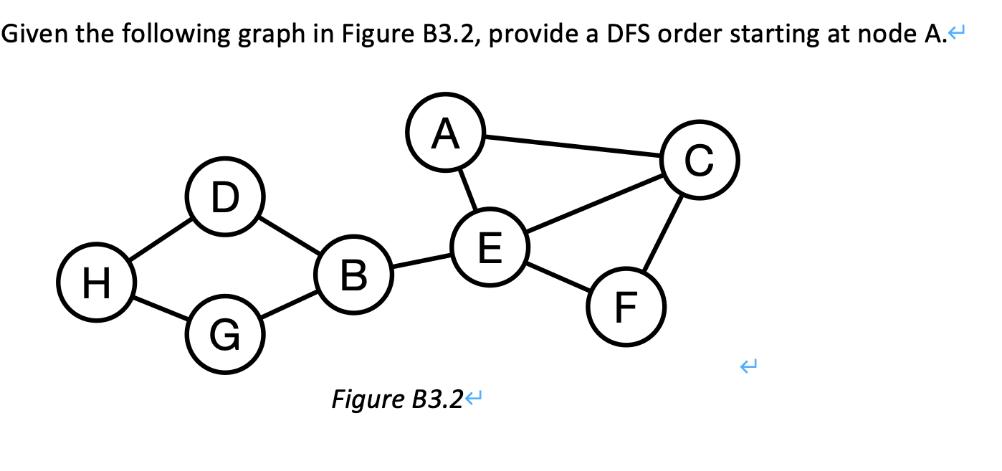
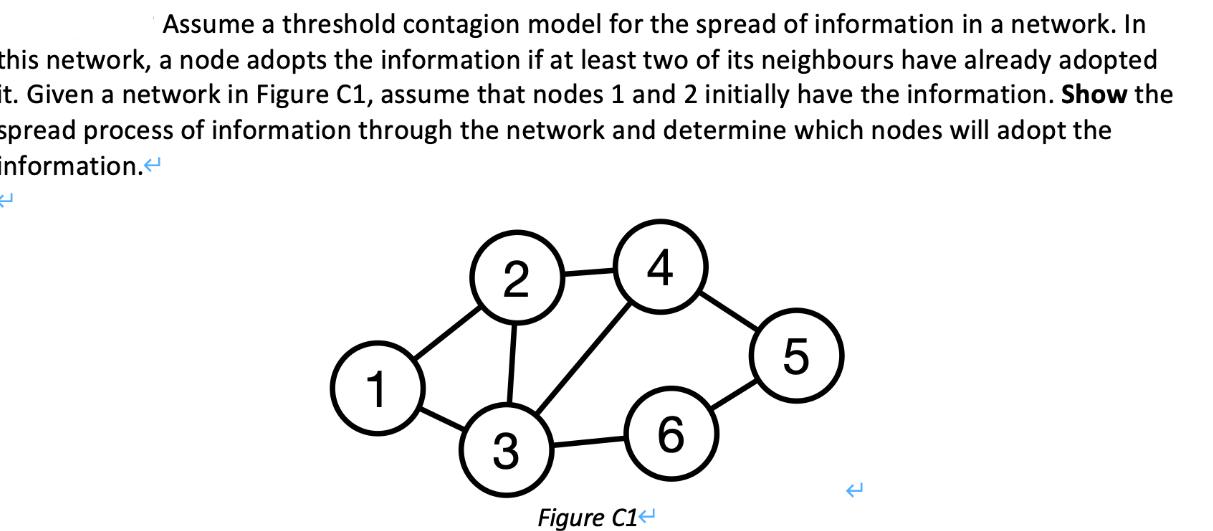
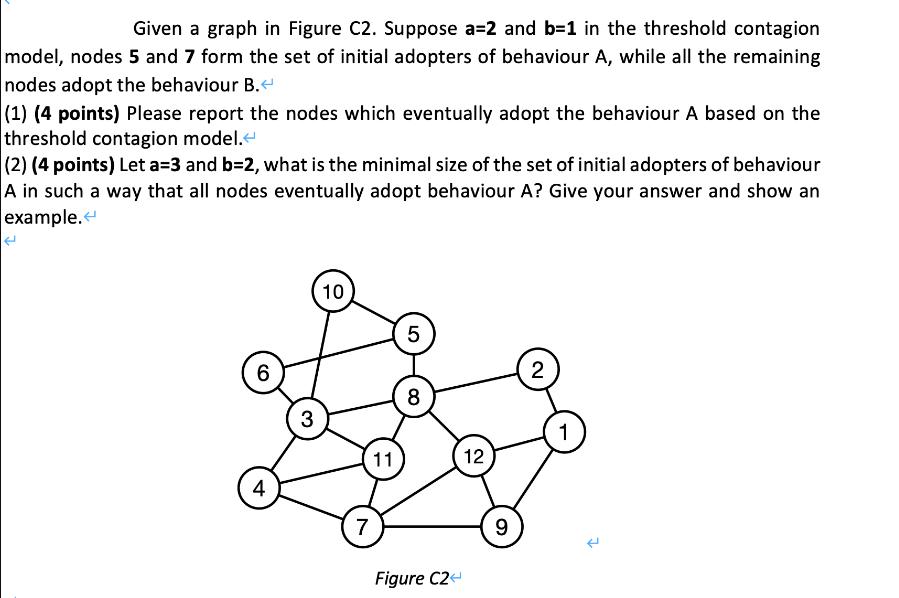
Given the following graph in Figure B2, calculate the amount of the betweenness flow value for each edge regarding the node A. Please provide computing details. < A H B F D Figure B2 < G C E Given the following graph in Figure B3.1, provide a BFS order starting at node A. < E F B A D Figure B3.1 H G Given the following graph in Figure B3.2, provide a DFS order starting at node A. < H D G B A E Figure B3.24 TI F Assume a threshold contagion model for the spread of information in a network. In this network, a node adopts the information if at least two of its neighbours have already adopted it. Given a network in Figure C1, assume that nodes 1 and 2 initially have the information. Show the spread process of information through the network and determine which nodes will adopt the information. < 1 2 4 oo 3 Figure C14 6 5 Given a graph in Figure C2. Suppose a=2 and b=1 in the threshold contagion model, nodes 5 and 7 form the set of initial adopters of behaviour A, while all the remaining nodes adopt the behaviour B. < (1) (4 points) Please report the nodes which eventually adopt the behaviour A based on the threshold contagion model. < (2) (4 points) Let a=3 and b=2, what is the minimal size of the set of initial adopters of behaviour A in such a way that all nodes eventually adopt behaviour A? Give your answer and show an example. 6 4 3 10 7 11 LO 5 8 Figure C2 < 12 9 2 1
Step by Step Solution
★★★★★
3.39 Rating (146 Votes )
There are 3 Steps involved in it
Step: 1

Get Instant Access to Expert-Tailored Solutions
See step-by-step solutions with expert insights and AI powered tools for academic success
Step: 2

Step: 3

Ace Your Homework with AI
Get the answers you need in no time with our AI-driven, step-by-step assistance
Get Started


