Question
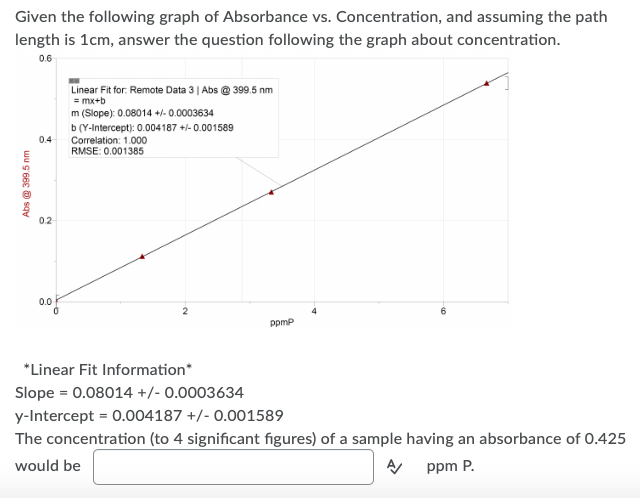
Given the following graph of Absorbance vs. Concentration, and assuming the path length is 1cm, answer the question following the graph about concentration. 0.6

Given the following graph of Absorbance vs. Concentration, and assuming the path length is 1cm, answer the question following the graph about concentration. 0.6 Abs @ 399.5 nm 0.4 Correlation: 1.000 RMSE: 0.001385 0.2 Linear Fit for: Remote Data 3 | Abs @ 399.5 nm =mx+b m (Slope): 0.08014 +/- 0.0003634 b (Y-Intercept): 0.004187 +/-0.001589 0.0 ppmp *Linear Fit Information* Slope = 0.08014 +/- 0.0003634 y-Intercept = 0.004187 +/- 0.001589 The concentration (to 4 significant figures) of a sample having an absorbance of 0.425 would be A/ ppm P.
Step by Step Solution
3.48 Rating (148 Votes )
There are 3 Steps involved in it
Step: 1
To determine the concentration of a sample with an absorbance of 04...
Get Instant Access to Expert-Tailored Solutions
See step-by-step solutions with expert insights and AI powered tools for academic success
Step: 2

Step: 3

Ace Your Homework with AI
Get the answers you need in no time with our AI-driven, step-by-step assistance
Get StartedRecommended Textbook for
Introduction to Management Science
Authors: Bernard W. Taylor
11th Edition
132751917, 978-0132751919
Students also viewed these Accounting questions
Question
Answered: 1 week ago
Question
Answered: 1 week ago
Question
Answered: 1 week ago
Question
Answered: 1 week ago
Question
Answered: 1 week ago
Question
Answered: 1 week ago
Question
Answered: 1 week ago
Question
Answered: 1 week ago
Question
Answered: 1 week ago
Question
Answered: 1 week ago
Question
Answered: 1 week ago
Question
Answered: 1 week ago
Question
Answered: 1 week ago
Question
Answered: 1 week ago
Question
Answered: 1 week ago
Question
Answered: 1 week ago
Question
Answered: 1 week ago
Question
Answered: 1 week ago
Question
Answered: 1 week ago
Question
Answered: 1 week ago
Question
Answered: 1 week ago
Question
Answered: 1 week ago
Question
Answered: 1 week ago
View Answer in SolutionInn App


