Question
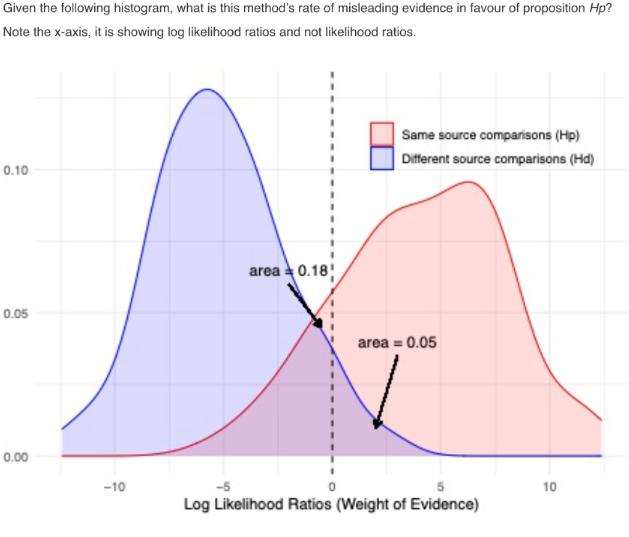
Given the following histogram, what is this method's rate of misleading evidence in favour of proposition Hp? Note the x-axis, it is showing log


Given the following histogram, what is this method's rate of misleading evidence in favour of proposition Hp? Note the x-axis, it is showing log likelihood ratios and not likelihood ratios. 0.10 0.05 0.00 -10 area 0.18! Same source comparisons (Hp) Different source comparisons (Hd) area= 0.05 -5 Log Likelihood Ratios (Weight of Evidence) 10 0 -5 0 0.05 0 0.11 0 0.18 00
Step by Step Solution
3.39 Rating (158 Votes )
There are 3 Steps involved in it
Step: 1
Solution Hd Blue area H Red There is two graph HP represent Rid Ac to tes the true values curve va...
Get Instant Access to Expert-Tailored Solutions
See step-by-step solutions with expert insights and AI powered tools for academic success
Step: 2

Step: 3

Ace Your Homework with AI
Get the answers you need in no time with our AI-driven, step-by-step assistance
Get StartedRecommended Textbook for
Understanding Basic Statistics
Authors: Charles Henry Brase, Corrinne Pellillo Brase
6th Edition
978-1133525097, 1133525091, 1111827028, 978-1133110316, 1133110312, 978-1111827021
Students also viewed these Accounting questions
Question
Answered: 1 week ago
Question
Answered: 1 week ago
Question
Answered: 1 week ago
Question
Answered: 1 week ago
Question
Answered: 1 week ago
Question
Answered: 1 week ago
Question
Answered: 1 week ago
Question
Answered: 1 week ago
Question
Answered: 1 week ago
Question
Answered: 1 week ago
Question
Answered: 1 week ago
Question
Answered: 1 week ago
Question
Answered: 1 week ago
Question
Answered: 1 week ago
Question
Answered: 1 week ago
Question
Answered: 1 week ago
Question
Answered: 1 week ago
Question
Answered: 1 week ago
Question
Answered: 1 week ago
Question
Answered: 1 week ago
Question
Answered: 1 week ago
View Answer in SolutionInn App


