Question
Given the following table (also available in the online resources) reporting the LOS for 60 pulmonary patients, create a statistics graph (histogram) of the


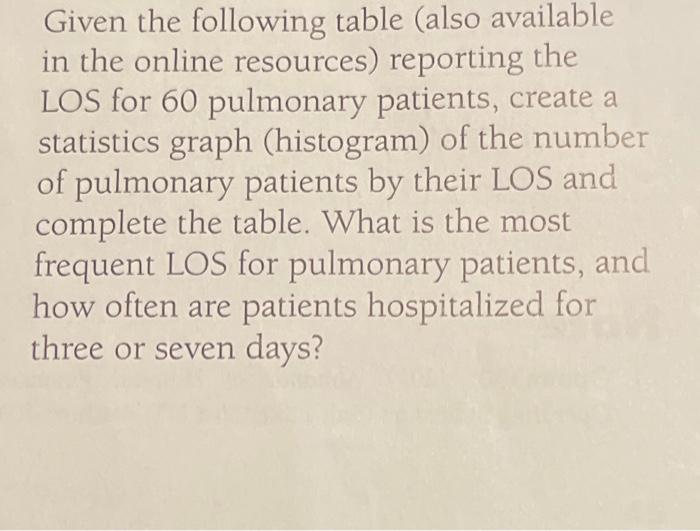
Given the following table (also available in the online resources) reporting the LOS for 60 pulmonary patients, create a statistics graph (histogram) of the number of pulmonary patients by their LOS and complete the table. What is the most frequent LOS for pulmonary patients, and how often are patients hospitalized for three or seven days? 3 4 5 6 19 20 LOS 16 18 12 13 14 15 1 2 3 4 5 6 8 9 10 11 7 Patient # Chapter 3 Using Excel Count LOS 4 6 3 7 5 4 7 5 3 4 3 5 4 4 4 3 5 3 4 Patient # 21 22 23 24 25 26 27 28 29 30 31 32 33 34 35 36 37 38 39 40 LOS 7 4 4 5 4 5 6 5 5 3 4 6 4 4 4 6 7 5 6 5 Patient # 41 42 43 44 45 46 47 48 49 50 51 52 53 54 55 56 57 58 59 60 LOS 3 5 5 3 5 4 4 6 LO 5 5 6 6 3 5 6 6 5 6 9 4
Step by Step Solution
3.52 Rating (155 Votes )
There are 3 Steps involved in it
Step: 1
SOLUTI...
Get Instant Access to Expert-Tailored Solutions
See step-by-step solutions with expert insights and AI powered tools for academic success
Step: 2

Step: 3

Ace Your Homework with AI
Get the answers you need in no time with our AI-driven, step-by-step assistance
Get StartedRecommended Textbook for
Linear Algebra with Applications
Authors: Steven J. Leon
7th edition
131857851, 978-0131857858
Students also viewed these Accounting questions
Question
Answered: 1 week ago
Question
Answered: 1 week ago
Question
Answered: 1 week ago
Question
Answered: 1 week ago
Question
Answered: 1 week ago
Question
Answered: 1 week ago
Question
Answered: 1 week ago
Question
Answered: 1 week ago
Question
Answered: 1 week ago
Question
Answered: 1 week ago
Question
Answered: 1 week ago
Question
Answered: 1 week ago
Question
Answered: 1 week ago
Question
Answered: 1 week ago
Question
Answered: 1 week ago
Question
Answered: 1 week ago
Question
Answered: 1 week ago
Question
Answered: 1 week ago
Question
Answered: 1 week ago
Question
Answered: 1 week ago
Question
Answered: 1 week ago
View Answer in SolutionInn App


