Answered step by step
Verified Expert Solution
Question
1 Approved Answer
Given the following time series dataset for X over a 48-month period. The dataset consists of monthly observations. We are interested in deasonalising the

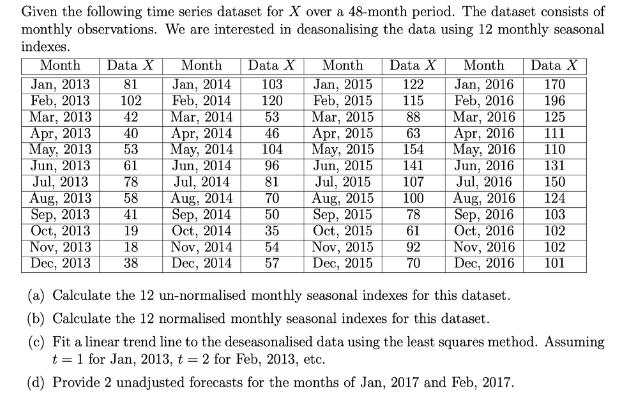
Given the following time series dataset for X over a 48-month period. The dataset consists of monthly observations. We are interested in deasonalising the data using 12 monthly seasonal indexes. Month Jan, 2013 Feb, 2013 Mar, 2013 Apr, 2013 May, 2013 Jun, 2013 Jul, 2013 Aug, 2013 Sep, 2013 Oct, 2013 Nov, 2013 Dec, 2013 Data X 81 102 42 40 53 61 78 58 41 19 18 38 Month Data X 103 120 53 46 Jan, 2014 Feb, 2014 Mar, 2014 Apr, 2014 May, 2014 Jun, 2014 Jul, 2014 Aug, 2014 Sep, 2014 Oct, 2014 Nov, 2014 104 96 81 70 50 35 54 Dec, 2014 57 Month Jan, 2015 Feb, 2015 Mar, 2015 Apr, 2015 May, 2015 Jun, 2015 Jul, 2015 Aug, 2015 Sep, 2015 Oct, 2015 Nov, 2015 Dec, 2015 Data X 122 115 88 63 154 141 107 100 78 61 92 70 Month Jan, 2016 Feb, 2016 Mar, 2016 Apr, 2016 May, 2016 Jun, 2016 Jul, 2016 Aug, 2016 Sep, 2016 Oct, 2016 Nov, 2016 Dec, 2016 Data X 170 196 125 111 110 131 150 124 103 102 102 101 (a) Calculate the 12 un-normalised monthly seasonal indexes for this dataset. (b) Calculate the 12 normalised monthly seasonal indexes for this dataset. (c) Fit a linear trend line to the deseasonalised data using the least squares method. Assuming t = 1 for Jan, 2013, t = 2 for Feb, 2013, etc. (d) Provide 2 unadjusted forecasts for the months of Jan, 2017 and Feb, 2017.
Step by Step Solution
★★★★★
3.40 Rating (163 Votes )
There are 3 Steps involved in it
Step: 1
To solve this problem we will follow the steps you provided a Calculate the 12 unnormalised ...
Get Instant Access to Expert-Tailored Solutions
See step-by-step solutions with expert insights and AI powered tools for academic success
Step: 2

Step: 3

Ace Your Homework with AI
Get the answers you need in no time with our AI-driven, step-by-step assistance
Get Started


