Answered step by step
Verified Expert Solution
Question
1 Approved Answer
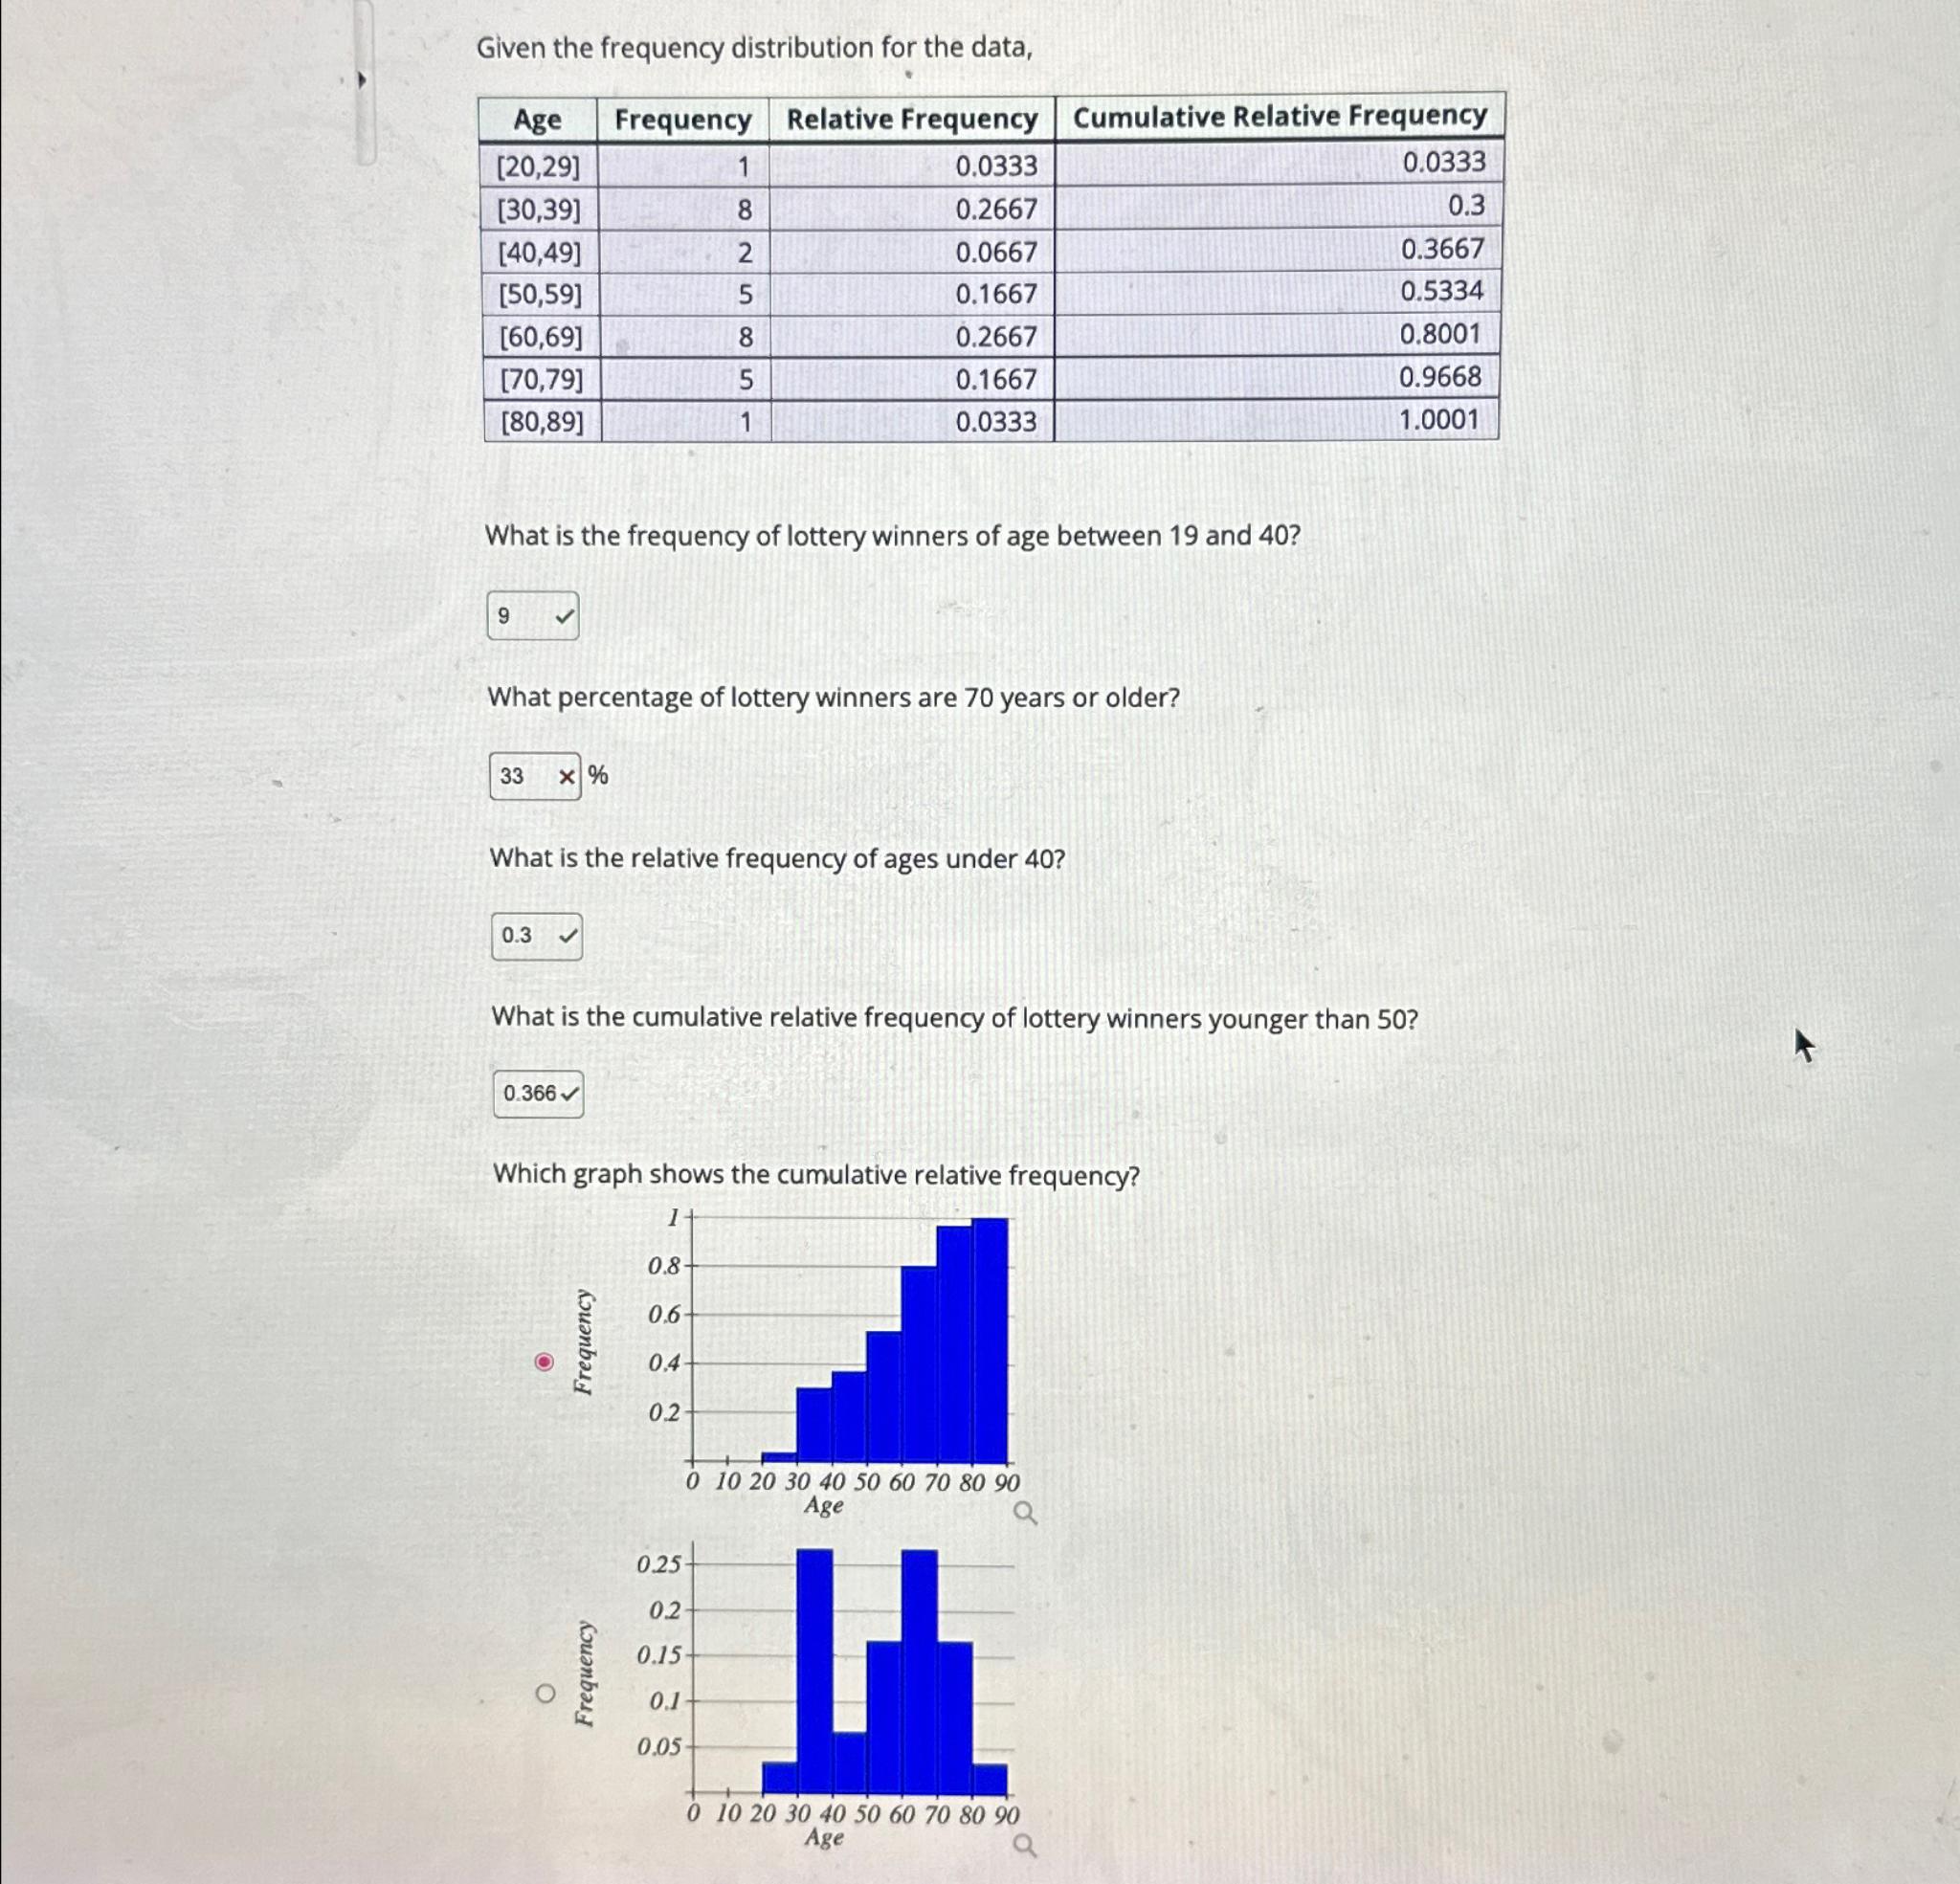
Given the frequency distribution for the data, Age Frequency Relative Frequency Cumulative Relative Frequency [20,29] 0.0333 [30,39] 0.3 0.3667 [40,49] [50,59] 0.5334 [60,69] 0.8001

Given the frequency distribution for the data, Age Frequency Relative Frequency Cumulative Relative Frequency [20,29] 0.0333 [30,39] 0.3 0.3667 [40,49] [50,59] 0.5334 [60,69] 0.8001 [70,79] 0.9668 [80,89] 1.0001 9 33 X % 0.3 What is the frequency of lottery winners of age between 19 and 40? 1 8 2 0.366 5 What percentage of lottery winners are 70 years or older? 85 Frequency 5 What is the relative frequency of ages under 40? Frequency 1 0.0333 0.2667 0.0667 0.1667 0.2667 0.1667 0.0333 What is the cumulative relative frequency of lottery winners younger than 50? 0.25 0.2 0.15- 0.1 0.05- Which graph shows the cumulative relative frequency? 1 0.8 0.6- 0.4 0.2 0 10 20 30 40 50 60 70 80 90 Age Q H 0 10 20 30 40 50 60 70 80 90 Age
Step by Step Solution
★★★★★
3.43 Rating (156 Votes )
There are 3 Steps involved in it
Step: 1
To find the percentage of lottery winners 70 years or older add the percentages for the age g...
Get Instant Access to Expert-Tailored Solutions
See step-by-step solutions with expert insights and AI powered tools for academic success
Step: 2

Step: 3

Ace Your Homework with AI
Get the answers you need in no time with our AI-driven, step-by-step assistance
Get Started


