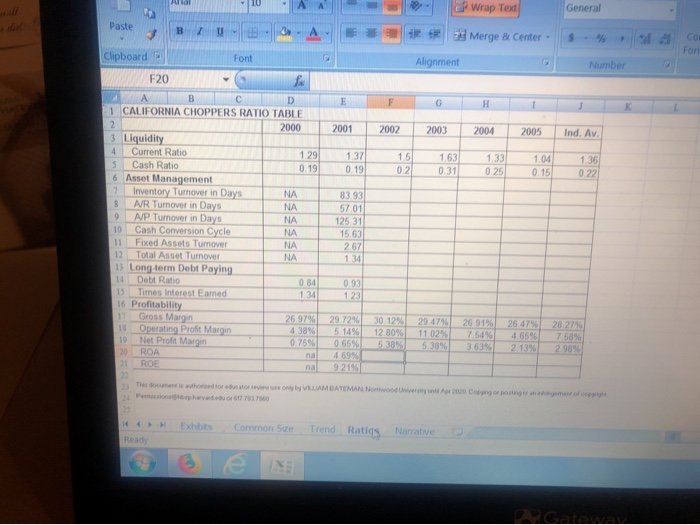
given the information from the common size tables, can someone help me figure out the missing ratios in the last picture
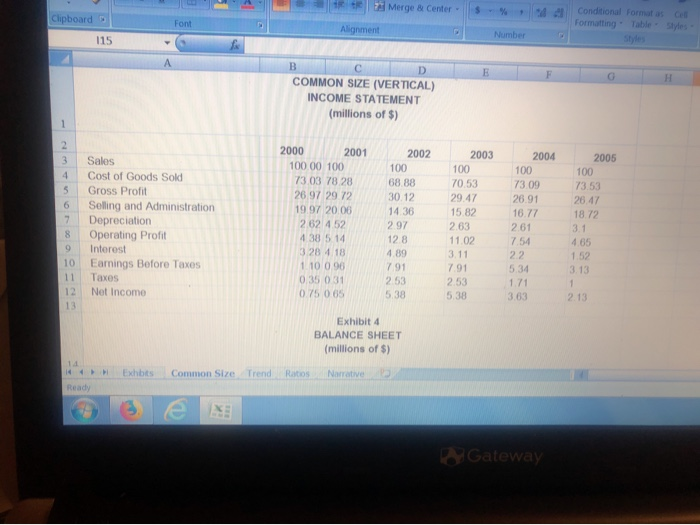
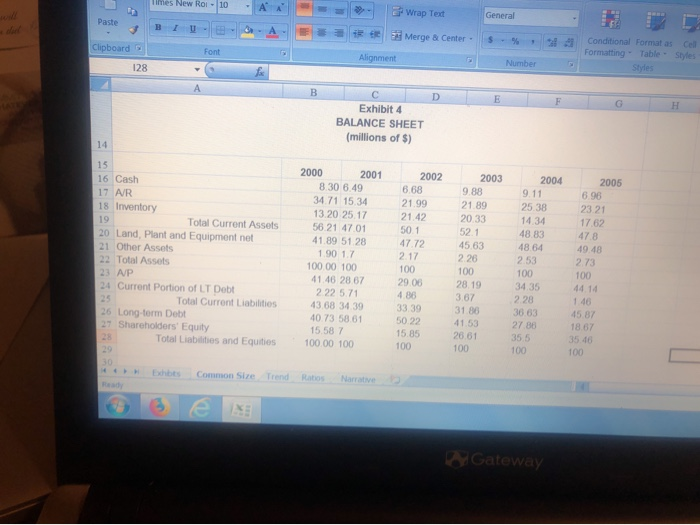
bH Merge & Center Clipboard Conditional Formatas Formatting Table Style Font Alignment Number COMMON SIZE (VERTICAL) INCOME STATEMENT (millions of $) Sales Cost of Goods Sold Gross Profit Selling and Administration Depreciation Operating Profit Interest Earnings Before Taxes 11 Taxes 12 Net Income 2000 2001 10000 100 7303 78 28 26.97 29 72 19.97 20.06 262 4.52 4 38 5 14 3.28 4.18 1.10 0.96 0.35 0 31 0.75 0.65 2002 100 68.88 30.12 14.36 2.97 128 4.89 7 91 2.53 5.38 2003 100 70.53 29.47 15 82 2.63 11.02 3.11 791 2.53 5.38 2004 100 73.09 26.91 16.77 261 7.54 22 5 34 1.71 3.63 2005 100 73 53 26.47 1872 3.1 4.65 1.52 3.13 2.13 Exhibit 4 BALANCE SHEET (millions of $) Ratos Narrative Exhbts Common Size Trend H1 Ready Gateway 1. mes blew Ros 10 A ===> wrap Text General Paste C BI- D Merge & Center - S -% Clipboard Alignment Conditional Format as Cell Formatting Table Styles Styles Numbers Exhibit 4 BALANCE SHEET (millions of $) 16 Cash 17 AR 18 Inventory 19 Total Current Assets 20 Land, Plant and Equipment net 21 Other Assets 22 Total Assets 23 AP 24 Current Portion of LT Debt 25 Total Current Liabilities 26 Long-term Debt 27 Shareholders' Equity Total Liabilities and Equities 2000 2001 8.30 6.49 34.71 15.34 13.20 25.17 56 21 47 01 41.89 51 28 1.90 1.7 100.00 100 41.46 28 67 2.22 5.71 43.68 34.39 40.73 58,61 15.58 7 100.00 100 2002 6.68 21.99 21.42 501 47.72 2.17 100 29.06 4.86 33.39 50.22 15.85 100 2003 9.88 21.89 20.33 52.1 45.63 2.26 100 28 19 3.67 31.86 41.53 26.61 100 2004 9.11 25.38 14.34 48 83 48.64 2.53 100 34 35 2.28 36.63 27.88 35 5 100 2005 6.96 2321 17.62 478 49.48 2.73 100 44.14 1.46 45.87 18.67 35.46 100 Exhibits Common Size Trend Rato Narrative Gateway A - - Wrap Ted General Paste BU Merge & Center - $ % Com Form Clipboard Font Alignment Number 2001 2002 2003 2004 2005 Ind. Av. 137 0.19 1.5 1.63 133 020310.25 1,04 0.15 1.36 0.22 F20 A B C 1 CALIFORNIA CHOPPERS RATIO TABLE 2000 3 Liquidity 4 Current Ratio 129 5 Cash Ratio 0.19 6 Asset Management 7 Inventory Turnover in Days 8 AR Turnover in Days NA 9 A/P Turnover in Days 10 Cash Conversion Cycle 11 Fixed Assets Turnover 12 Total Asset Turnover 13 Long term Debt Paying 14 Debt Ratio 15 Times Interest Eamed 16 Profitability 1 Gross Margen 26 979 18 Operating Profit Margin 438% 19 Net Profit Margin 0.75% 20 ROA na 21 ROE na suggests 83.93 57.01 125 31 15.63 2.57 29 724630 12% 29 4796 269196 26 4795 28.279 5 14 12 80961102517 54% 1659675896 0.65% 5 38% 5389636392 1396 29896 4699 9219 The documentado hoto VILLAMBATEMANN 2000 C P opo m a Exchbts Common Se Trend Ratios Narrative Red bH Merge & Center Clipboard Conditional Formatas Formatting Table Style Font Alignment Number COMMON SIZE (VERTICAL) INCOME STATEMENT (millions of $) Sales Cost of Goods Sold Gross Profit Selling and Administration Depreciation Operating Profit Interest Earnings Before Taxes 11 Taxes 12 Net Income 2000 2001 10000 100 7303 78 28 26.97 29 72 19.97 20.06 262 4.52 4 38 5 14 3.28 4.18 1.10 0.96 0.35 0 31 0.75 0.65 2002 100 68.88 30.12 14.36 2.97 128 4.89 7 91 2.53 5.38 2003 100 70.53 29.47 15 82 2.63 11.02 3.11 791 2.53 5.38 2004 100 73.09 26.91 16.77 261 7.54 22 5 34 1.71 3.63 2005 100 73 53 26.47 1872 3.1 4.65 1.52 3.13 2.13 Exhibit 4 BALANCE SHEET (millions of $) Ratos Narrative Exhbts Common Size Trend H1 Ready Gateway 1. mes blew Ros 10 A ===> wrap Text General Paste C BI- D Merge & Center - S -% Clipboard Alignment Conditional Format as Cell Formatting Table Styles Styles Numbers Exhibit 4 BALANCE SHEET (millions of $) 16 Cash 17 AR 18 Inventory 19 Total Current Assets 20 Land, Plant and Equipment net 21 Other Assets 22 Total Assets 23 AP 24 Current Portion of LT Debt 25 Total Current Liabilities 26 Long-term Debt 27 Shareholders' Equity Total Liabilities and Equities 2000 2001 8.30 6.49 34.71 15.34 13.20 25.17 56 21 47 01 41.89 51 28 1.90 1.7 100.00 100 41.46 28 67 2.22 5.71 43.68 34.39 40.73 58,61 15.58 7 100.00 100 2002 6.68 21.99 21.42 501 47.72 2.17 100 29.06 4.86 33.39 50.22 15.85 100 2003 9.88 21.89 20.33 52.1 45.63 2.26 100 28 19 3.67 31.86 41.53 26.61 100 2004 9.11 25.38 14.34 48 83 48.64 2.53 100 34 35 2.28 36.63 27.88 35 5 100 2005 6.96 2321 17.62 478 49.48 2.73 100 44.14 1.46 45.87 18.67 35.46 100 Exhibits Common Size Trend Rato Narrative Gateway A - - Wrap Ted General Paste BU Merge & Center - $ % Com Form Clipboard Font Alignment Number 2001 2002 2003 2004 2005 Ind. Av. 137 0.19 1.5 1.63 133 020310.25 1,04 0.15 1.36 0.22 F20 A B C 1 CALIFORNIA CHOPPERS RATIO TABLE 2000 3 Liquidity 4 Current Ratio 129 5 Cash Ratio 0.19 6 Asset Management 7 Inventory Turnover in Days 8 AR Turnover in Days NA 9 A/P Turnover in Days 10 Cash Conversion Cycle 11 Fixed Assets Turnover 12 Total Asset Turnover 13 Long term Debt Paying 14 Debt Ratio 15 Times Interest Eamed 16 Profitability 1 Gross Margen 26 979 18 Operating Profit Margin 438% 19 Net Profit Margin 0.75% 20 ROA na 21 ROE na suggests 83.93 57.01 125 31 15.63 2.57 29 724630 12% 29 4796 269196 26 4795 28.279 5 14 12 80961102517 54% 1659675896 0.65% 5 38% 5389636392 1396 29896 4699 9219 The documentado hoto VILLAMBATEMANN 2000 C P opo m a Exchbts Common Se Trend Ratios Narrative Red