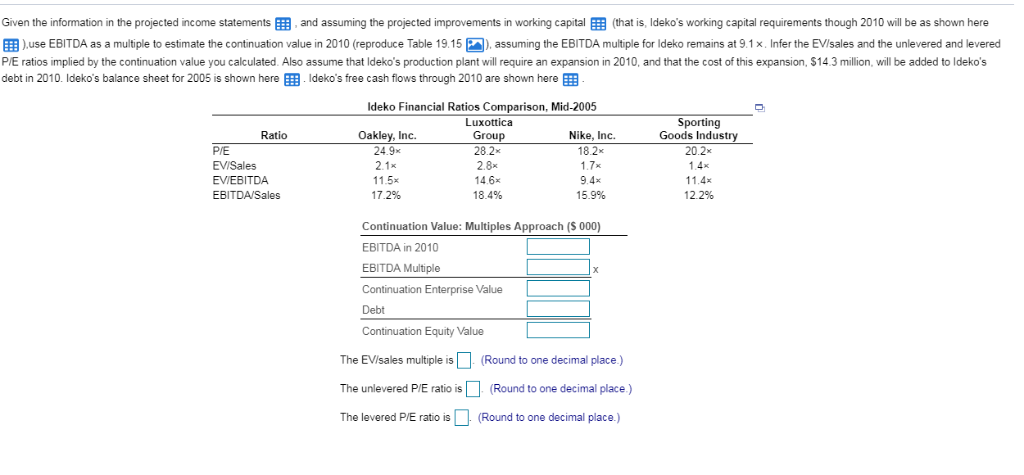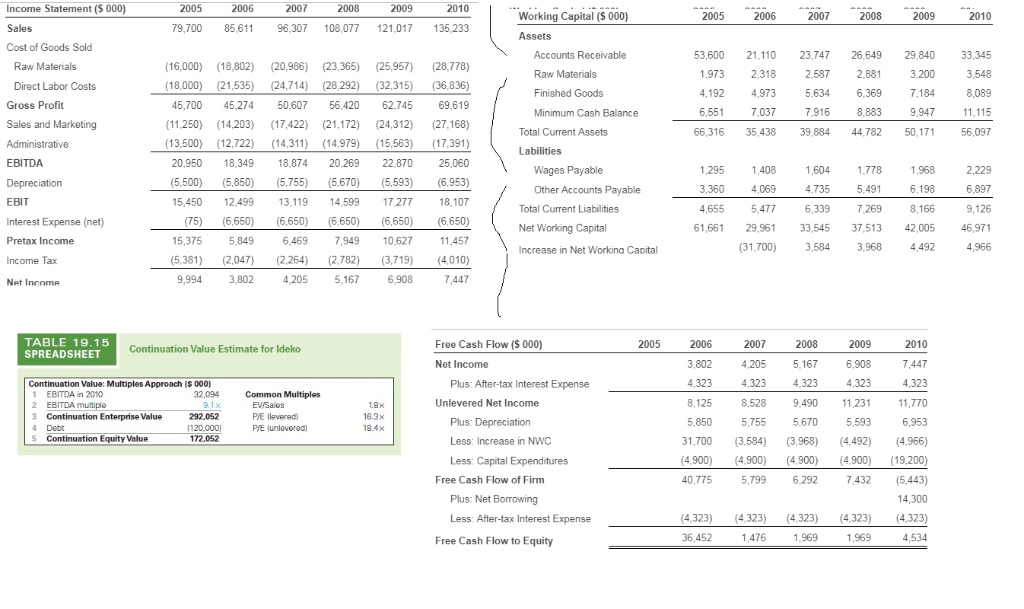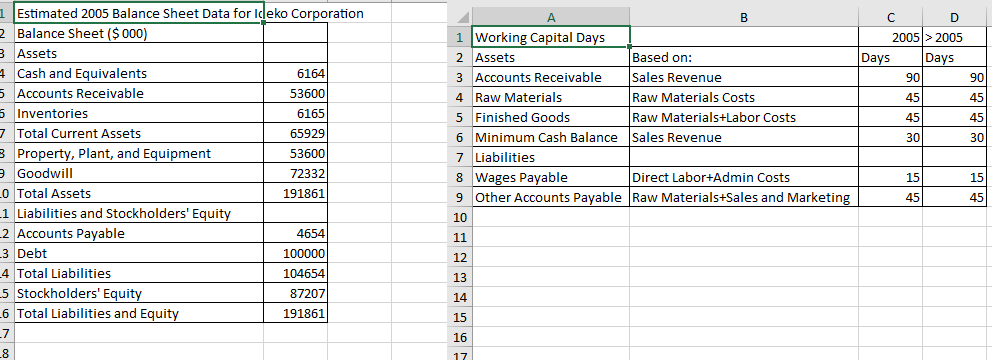


Given the information in the projected income statementsEE, and assuming the projected improvements in working capital EE (that is, Ideko's working capital requirements though 2010 will be as shown here use EBITDA as a multiple to estimate he continua on value in 2010 reproduce Table 1915 ), assuming the EBITDA multiple Ideko emains at 9.1 Infer the EV/sales and he unlevered and levered P/E ratios implied by the continuation value you calculated. Also assume that Ideko's production plant will require an expansion in 2010, and that the cost of this expansion, $14.3 million, will be added to Ideko's debt in 2010. Ideko's balance sheet for 2005 is shown here EEs Ideko's free cash flows through 2010 are shown here EE Ideko Financial Ratios Comparison, Mid-2005 Luxottica Sporting Ratio PIE EVISales EVEBITDA EBITDA/Sales Oakley, Inc. 24.9 2.1x 11.5x 17.2% Group 28.2 2.8x 14.6x 18.4% Nike, Inc. 18.2x 1.7x 9.4x 15.9% Goods Industr 20.2x 11.4x 12.2% Continuation Value: Multiples Approach (S 000) EBITDA in 2010 EBITDA Multiple Continuation Enterprise Value Debt Continuation Equity Value The EVisales multiple isRound to one decimal place) The unlevered PIE ratio is(Round to one decimal place.) The levered P/E ratio is(Round to one decimal place.) Income Statement ($ 000) Sales Cost of Goods Sold 2005 2006 2007 2009 Working Capital (S 000) 2005 2006 2007 2008 2009 2010 79,700 85,611 96,307 108,077 121,017 135,233 Accounts Receivable Raw Materials Finished Goods Minimum Cash Balance 53,600 21.110 23,747 26,649 29,840 33,345 3,548 8,089 11,115 66,31635,438 39,884 44,782 50,171 56,097 Raw Materials 16,000) 18,802 (20,986) (23,365 (25,957) (28,778) 18,000) 21,535 (24,714) (28,292) (32,315) (36,836) 5,70045,27450,607 56,420 62,745 69,619 (11,250) 14,203 (17,422) 21,72 (24,312 (27,168) 13,500) 2,722) 14,311) (14,979) 15,563 17,391) 20,950 18,349 18,874 20,269 22,870 25,060 (5,500 (5,850) 575(5,670) 5,593) 6,953) 5,45012,499 13.119 14,599 17.27718,107 (75) (6,650 6,650) 6,650 6,650 6,650) 5,375 5849 6,469 7,949 10,62711,457 5,381) (2,047) ,264 ,782 3,719) (4,010) 1,9732,318 2,587 2,881 3.200 5,634 7,916 Direct Labor Costs 4.192 4,973 6,369 Gross Profit 8,883 Sales and Marketing Total Current Assets Labilities EBITDA 1,295 1 3,360 4,655 5,4776,339 7,269 8,166 Wages Payable 1,408 1,604 1778 1,968 2,229 Other Accounts Payable Total Current Liabilities Net Working Capital Increase in Net Workina Capital 6,897 EBIT Interest Expense (net) Pretax Income 61,661 29,961 33,545 37,513 42,005 46,97 31,700) 3,584 3,968 4492 4,966 Net Income ,994 3,802 205 6,908 TABLE 19.15 SPREADSHEET Free Cash Flow (S 000) 2005 2006 2007 2008 2009 2010 Continuation Value Estimate for Ideko Net Income 3,802 4,205 5,167 6,908 323 4,323 4323 8,528 9.490 11,231 5,670 1,700 3,584) 3,96 (4492) (4,966) 4,900) (4900) (4,900) (4,900) 19,200) 40,7755,7996,292 7432 (5,443) Continuation Value: Multiples Approach (S 000) Plus: After-tax Interest Expense 1 EBITDA in 2010 EBITDA multiplo Continuation Enterprise Value Dobt Continuation Equity Value 32.094 Common Multiples Unlevered Net Income 8,125 11,770 2 3 4 5 292,052 120,000 172,052 P/E (levered P/E lunlovered) 16.3x 19.4x 5,850 5,755 5,593 6,953 Less: Increase in NWC Less: Capital Expenditures Free Cash Flow of Firm Plus: Net Borrowing Less: After-tax Interest Expense 14,300 4,323 (4,323) 4,323 (4,323) (4,323) 1,969 Free Cash Flow to Equity 1,969 1 Estimated 2005 Balance Sheet Data for Ideko Corporation 2 Balance Sheet ($ 000 1 Working Capital Days 2 Assets 3 Accounts Receivable Sales Revenue 4 Raw Materials 5 Finished Goods 6 Minimum Cash Balance Sales Revenue 7 Liabilities 8 Wages Payable 9 Other Accounts Pavable Raw Materials+Sales and Marketin 10 2005 2005 Assets 1 Cash and Equivalents 5 Accounts Receivable 5 Inventories 7 Total Current Assets Based on: Davs Davs 6164 53600 6165 65929 53600 72332 191861 Raw Materials Costs Raw Materials+Labor Costs 45 45 Pro , Plant, and Equipment Goodwill 0 Total Assets 1 Liabilities and Stockholders' Equi 2 Accounts Payable 3 Debt 4 Total Liabilities 5 Stockholders' Equity 6 Total Liabilities and Equi Direct Labor Admin Costs 15 15 100000 104654 87207 191861 12 13 14 15 16 17 Given the information in the projected income statementsEE, and assuming the projected improvements in working capital EE (that is, Ideko's working capital requirements though 2010 will be as shown here use EBITDA as a multiple to estimate he continua on value in 2010 reproduce Table 1915 ), assuming the EBITDA multiple Ideko emains at 9.1 Infer the EV/sales and he unlevered and levered P/E ratios implied by the continuation value you calculated. Also assume that Ideko's production plant will require an expansion in 2010, and that the cost of this expansion, $14.3 million, will be added to Ideko's debt in 2010. Ideko's balance sheet for 2005 is shown here EEs Ideko's free cash flows through 2010 are shown here EE Ideko Financial Ratios Comparison, Mid-2005 Luxottica Sporting Ratio PIE EVISales EVEBITDA EBITDA/Sales Oakley, Inc. 24.9 2.1x 11.5x 17.2% Group 28.2 2.8x 14.6x 18.4% Nike, Inc. 18.2x 1.7x 9.4x 15.9% Goods Industr 20.2x 11.4x 12.2% Continuation Value: Multiples Approach (S 000) EBITDA in 2010 EBITDA Multiple Continuation Enterprise Value Debt Continuation Equity Value The EVisales multiple isRound to one decimal place) The unlevered PIE ratio is(Round to one decimal place.) The levered P/E ratio is(Round to one decimal place.) Income Statement ($ 000) Sales Cost of Goods Sold 2005 2006 2007 2009 Working Capital (S 000) 2005 2006 2007 2008 2009 2010 79,700 85,611 96,307 108,077 121,017 135,233 Accounts Receivable Raw Materials Finished Goods Minimum Cash Balance 53,600 21.110 23,747 26,649 29,840 33,345 3,548 8,089 11,115 66,31635,438 39,884 44,782 50,171 56,097 Raw Materials 16,000) 18,802 (20,986) (23,365 (25,957) (28,778) 18,000) 21,535 (24,714) (28,292) (32,315) (36,836) 5,70045,27450,607 56,420 62,745 69,619 (11,250) 14,203 (17,422) 21,72 (24,312 (27,168) 13,500) 2,722) 14,311) (14,979) 15,563 17,391) 20,950 18,349 18,874 20,269 22,870 25,060 (5,500 (5,850) 575(5,670) 5,593) 6,953) 5,45012,499 13.119 14,599 17.27718,107 (75) (6,650 6,650) 6,650 6,650 6,650) 5,375 5849 6,469 7,949 10,62711,457 5,381) (2,047) ,264 ,782 3,719) (4,010) 1,9732,318 2,587 2,881 3.200 5,634 7,916 Direct Labor Costs 4.192 4,973 6,369 Gross Profit 8,883 Sales and Marketing Total Current Assets Labilities EBITDA 1,295 1 3,360 4,655 5,4776,339 7,269 8,166 Wages Payable 1,408 1,604 1778 1,968 2,229 Other Accounts Payable Total Current Liabilities Net Working Capital Increase in Net Workina Capital 6,897 EBIT Interest Expense (net) Pretax Income 61,661 29,961 33,545 37,513 42,005 46,97 31,700) 3,584 3,968 4492 4,966 Net Income ,994 3,802 205 6,908 TABLE 19.15 SPREADSHEET Free Cash Flow (S 000) 2005 2006 2007 2008 2009 2010 Continuation Value Estimate for Ideko Net Income 3,802 4,205 5,167 6,908 323 4,323 4323 8,528 9.490 11,231 5,670 1,700 3,584) 3,96 (4492) (4,966) 4,900) (4900) (4,900) (4,900) 19,200) 40,7755,7996,292 7432 (5,443) Continuation Value: Multiples Approach (S 000) Plus: After-tax Interest Expense 1 EBITDA in 2010 EBITDA multiplo Continuation Enterprise Value Dobt Continuation Equity Value 32.094 Common Multiples Unlevered Net Income 8,125 11,770 2 3 4 5 292,052 120,000 172,052 P/E (levered P/E lunlovered) 16.3x 19.4x 5,850 5,755 5,593 6,953 Less: Increase in NWC Less: Capital Expenditures Free Cash Flow of Firm Plus: Net Borrowing Less: After-tax Interest Expense 14,300 4,323 (4,323) 4,323 (4,323) (4,323) 1,969 Free Cash Flow to Equity 1,969 1 Estimated 2005 Balance Sheet Data for Ideko Corporation 2 Balance Sheet ($ 000 1 Working Capital Days 2 Assets 3 Accounts Receivable Sales Revenue 4 Raw Materials 5 Finished Goods 6 Minimum Cash Balance Sales Revenue 7 Liabilities 8 Wages Payable 9 Other Accounts Pavable Raw Materials+Sales and Marketin 10 2005 2005 Assets 1 Cash and Equivalents 5 Accounts Receivable 5 Inventories 7 Total Current Assets Based on: Davs Davs 6164 53600 6165 65929 53600 72332 191861 Raw Materials Costs Raw Materials+Labor Costs 45 45 Pro , Plant, and Equipment Goodwill 0 Total Assets 1 Liabilities and Stockholders' Equi 2 Accounts Payable 3 Debt 4 Total Liabilities 5 Stockholders' Equity 6 Total Liabilities and Equi Direct Labor Admin Costs 15 15 100000 104654 87207 191861 12 13 14 15 16 17


