Given the marginal corporate tax rate of 40% in the case, how much value would be added if the company pursue the strategy proposed leverage recapitalization?
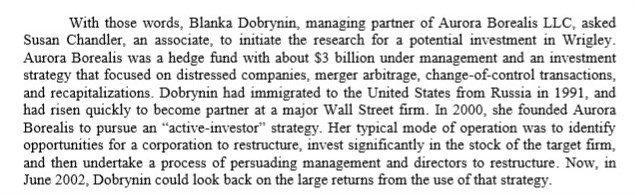
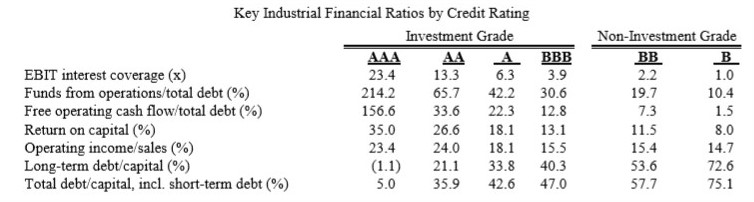
With those words, Blanka Dobrynin, managing partner of Aurora Borealis LLC, asked Susan Chandler, an associate, to initiate the research for a potential investment in Wrigley Aurora Borealis was a hedge fund with about $3 billion under management and an investment strategy that focused on distressed companies, merger arbitrage, change-of-control transactions, and recapitalizations. Dobrynin had immigrated to the United States from Russia in 1991, and had risen quickly to become partner at a major Wall Street firm. In 2000, she founded Aurora Borealis to pursue an "active-investor" strategy. Her typical mode of operation was to identify opportunities for a corporation to restructure, invest significantly in the stock of the target firm, and then undertake a process of persuading management and directors to restructure. Now, in June 2002, Dobrynin could look back on the large returns from the use of that strategy. Consolidated Balance Sheets for the Company (in thousands of dollars) ASSETS Current assets: 2001 2000 Cash and equivalents Short-term investments, at amortized cost Accounts receivable Inventories S 307,785 S 300,599 29,301 239,885 191,570 25,450 75,693 203,288 278,981 46,896 14.846 913,843 25,300 115,745 26,381 64,676 188,615 Finished goods Raw materials and supplies 39,728 14.226 Other current assets Deferred income taxes current Total curent assets Marketable equity securities, at fair value Deferred charges and other assets Deferred income taxes noncurrent Property, plant, and equipment (at cost) Land Buildings and building eqpment 28,535 83,713 26,743 39,933 359,109 857.0 39,125 344,457 756.050 and e ent Less accumulated depreciation 571,717532,598 607.034 Net lant and ent 684,379 LIABILITIES AND STOCKHOLDERS' EQUITY Current liabilities: S 91,225 73,129 128,406 13,779 39,467 60,976 Accounts payable Accrued expenses Dividends payable 42,711 68,437 1.455 Income and other taxes payable Deferred income taxes current current ties Deferred income taxes noncurrent Other non-current liabilities Common stock Class B convertible stock Additional paid-in capital Retained earnings Treasury stock Accumulated other com Total stockholders' equity 40,144 13,921 113,489 12,558 2,938 346 1,684,3371,492,547 (289,799 (256,478) 119,014 1,276,287 1,132.897 43,206 12,646 2,850 1,153 ve income 134 765,64 Income Statements for the Company year ended December 31 2001 (in thousands, except per-share amounts) Earnings Net sales Cost of sales Gross profit Selling, general and admininstrative expenses Operating income Investment income Other expense Earnings before income taxes Income taxes Net earnings 2000 1999 S 2,429,646 $ 2,145,706 $ 2,061,602 904,183 1,157,419 721,813 435,606 17,636 8,812 444,430 136,247 S362,986 $328,942 $ 308,183 997,054 1,432,592 919,236 513,356 18,553 4,543 527,366 164,380 904,266 1,241,440 778,197 463,243 19,185 3,116 479,312 150,370 Per-share amounts Net earnings per share of common stock Dividends paid per share of common stock 1.61 0.745 $ 1.45 $ 0.70 $ 1.33 0.66 S Source of data: Company regulatory filings Financial Characteristics of Major Confectionary Firms LT Debt LT Debt LT Debt Common Shares Market ook LT Outstandi Value of Value of Total LT +Book (LT Debt+Debt/Book LT Debt/ Debt Value of Mkt Value Value of Mkt Value Equity of Equity Recent ng Equity Equity Company Name Cadbury Schweppes plc $ 26.66 502.50 $ 13,397 S 5,264 $ 2,264 30.07% 14.46% 43.01% i6.90% Hershey Foods Corp. $ 65.45 136.63$ 8,942$2,785$ 869 23.77% 8.85% 31.18% 9.71% Kraft Foods Tootse Roll Industries Inc. $ 31.17 51.66$ 1,610 S 509 $ 8 1.45% .46% 47% O.47% Wm. Wrigley Jr. Co. $ 56.37 232.44 $13,103 $1,276 $-0.00% 0.00% 0.00% 0.00% S&P 500 Composite Price (millions) (millions)(millions)(millions)Equiy) of Equity $ 38.82 1,735.00 $ 67,353 $39,920 $ 8,548 17.64% 11.26% 21.41% 12.69% $1,148.08 18.23% 8.76% 24.27% 9.94% Compound Interest Growth of Company Name Cadbury Schweppes plc Hershey Foods Corp Kraft Foods Price/Cash Dividend Dividend Coverage EPS Past5 Firm Value/ Yrs EBITDA 10.3 11.4 Beta 0.60 EPS Earnings Dividend Payout 1.39 Yield Before Ta 6.50% 0.60 2.74 20.40 $ 1.16 41.0% 2.00% 11.1x 6.50% nmf nmf 12.50% nmf 9.00% -49.57% 15.20 0.67 44.0% 2.50% 4.6x nmf 1.17 18.70 $0.26 12.0% 1.50% Tootse Roll Industries Inc. 0.65 1.30 24.00 $ 0.28 22.0% 0.90% 0.75 1.61 29.30 $ 0.75 46.0% 1.50% 3.4x 14.6 22.6 Wm. Wrigley Jr. Co. S&P 500 Composite 1.00 18.78 40.55 Key Industrial Financial Ratios by Credit Rating Investment Grade Non-Investment Grade 13.3 EBIT interest coverage (x) Funds from operations/total debt (%) Free operating cash flow/total debt (%) Return on capital (%) Operating income/sales (%) Long-term debt/capital (%) Total debt/capital, incl. short-term debt (%) 23.4 214.2 156.6 35.0 23.4 6.3 3.9 65.7 42.2 30.6 33.6 22.3 12.8 26.6 18.1 13.1 24.0 18.1 15.5 (1.1) 21. 33.8 40.3 35.9 42.6 47.0 2.2 19.7 7.3 11.5 15.4 53.6 57.7 1.0 10.4 1.5 8.0 14.7 72.6 75.1 5.0 With those words, Blanka Dobrynin, managing partner of Aurora Borealis LLC, asked Susan Chandler, an associate, to initiate the research for a potential investment in Wrigley Aurora Borealis was a hedge fund with about $3 billion under management and an investment strategy that focused on distressed companies, merger arbitrage, change-of-control transactions, and recapitalizations. Dobrynin had immigrated to the United States from Russia in 1991, and had risen quickly to become partner at a major Wall Street firm. In 2000, she founded Aurora Borealis to pursue an "active-investor" strategy. Her typical mode of operation was to identify opportunities for a corporation to restructure, invest significantly in the stock of the target firm, and then undertake a process of persuading management and directors to restructure. Now, in June 2002, Dobrynin could look back on the large returns from the use of that strategy. Consolidated Balance Sheets for the Company (in thousands of dollars) ASSETS Current assets: 2001 2000 Cash and equivalents Short-term investments, at amortized cost Accounts receivable Inventories S 307,785 S 300,599 29,301 239,885 191,570 25,450 75,693 203,288 278,981 46,896 14.846 913,843 25,300 115,745 26,381 64,676 188,615 Finished goods Raw materials and supplies 39,728 14.226 Other current assets Deferred income taxes current Total curent assets Marketable equity securities, at fair value Deferred charges and other assets Deferred income taxes noncurrent Property, plant, and equipment (at cost) Land Buildings and building eqpment 28,535 83,713 26,743 39,933 359,109 857.0 39,125 344,457 756.050 and e ent Less accumulated depreciation 571,717532,598 607.034 Net lant and ent 684,379 LIABILITIES AND STOCKHOLDERS' EQUITY Current liabilities: S 91,225 73,129 128,406 13,779 39,467 60,976 Accounts payable Accrued expenses Dividends payable 42,711 68,437 1.455 Income and other taxes payable Deferred income taxes current current ties Deferred income taxes noncurrent Other non-current liabilities Common stock Class B convertible stock Additional paid-in capital Retained earnings Treasury stock Accumulated other com Total stockholders' equity 40,144 13,921 113,489 12,558 2,938 346 1,684,3371,492,547 (289,799 (256,478) 119,014 1,276,287 1,132.897 43,206 12,646 2,850 1,153 ve income 134 765,64 Income Statements for the Company year ended December 31 2001 (in thousands, except per-share amounts) Earnings Net sales Cost of sales Gross profit Selling, general and admininstrative expenses Operating income Investment income Other expense Earnings before income taxes Income taxes Net earnings 2000 1999 S 2,429,646 $ 2,145,706 $ 2,061,602 904,183 1,157,419 721,813 435,606 17,636 8,812 444,430 136,247 S362,986 $328,942 $ 308,183 997,054 1,432,592 919,236 513,356 18,553 4,543 527,366 164,380 904,266 1,241,440 778,197 463,243 19,185 3,116 479,312 150,370 Per-share amounts Net earnings per share of common stock Dividends paid per share of common stock 1.61 0.745 $ 1.45 $ 0.70 $ 1.33 0.66 S Source of data: Company regulatory filings Financial Characteristics of Major Confectionary Firms LT Debt LT Debt LT Debt Common Shares Market ook LT Outstandi Value of Value of Total LT +Book (LT Debt+Debt/Book LT Debt/ Debt Value of Mkt Value Value of Mkt Value Equity of Equity Recent ng Equity Equity Company Name Cadbury Schweppes plc $ 26.66 502.50 $ 13,397 S 5,264 $ 2,264 30.07% 14.46% 43.01% i6.90% Hershey Foods Corp. $ 65.45 136.63$ 8,942$2,785$ 869 23.77% 8.85% 31.18% 9.71% Kraft Foods Tootse Roll Industries Inc. $ 31.17 51.66$ 1,610 S 509 $ 8 1.45% .46% 47% O.47% Wm. Wrigley Jr. Co. $ 56.37 232.44 $13,103 $1,276 $-0.00% 0.00% 0.00% 0.00% S&P 500 Composite Price (millions) (millions)(millions)(millions)Equiy) of Equity $ 38.82 1,735.00 $ 67,353 $39,920 $ 8,548 17.64% 11.26% 21.41% 12.69% $1,148.08 18.23% 8.76% 24.27% 9.94% Compound Interest Growth of Company Name Cadbury Schweppes plc Hershey Foods Corp Kraft Foods Price/Cash Dividend Dividend Coverage EPS Past5 Firm Value/ Yrs EBITDA 10.3 11.4 Beta 0.60 EPS Earnings Dividend Payout 1.39 Yield Before Ta 6.50% 0.60 2.74 20.40 $ 1.16 41.0% 2.00% 11.1x 6.50% nmf nmf 12.50% nmf 9.00% -49.57% 15.20 0.67 44.0% 2.50% 4.6x nmf 1.17 18.70 $0.26 12.0% 1.50% Tootse Roll Industries Inc. 0.65 1.30 24.00 $ 0.28 22.0% 0.90% 0.75 1.61 29.30 $ 0.75 46.0% 1.50% 3.4x 14.6 22.6 Wm. Wrigley Jr. Co. S&P 500 Composite 1.00 18.78 40.55 Key Industrial Financial Ratios by Credit Rating Investment Grade Non-Investment Grade 13.3 EBIT interest coverage (x) Funds from operations/total debt (%) Free operating cash flow/total debt (%) Return on capital (%) Operating income/sales (%) Long-term debt/capital (%) Total debt/capital, incl. short-term debt (%) 23.4 214.2 156.6 35.0 23.4 6.3 3.9 65.7 42.2 30.6 33.6 22.3 12.8 26.6 18.1 13.1 24.0 18.1 15.5 (1.1) 21. 33.8 40.3 35.9 42.6 47.0 2.2 19.7 7.3 11.5 15.4 53.6 57.7 1.0 10.4 1.5 8.0 14.7 72.6 75.1 5.0