Answered step by step
Verified Expert Solution
Link Copied!

Question

1 Approved Answer

Given the monthly rate of return for two assets during a six-month period in Table 1. Compute the following: Draw the figure of opportunity set
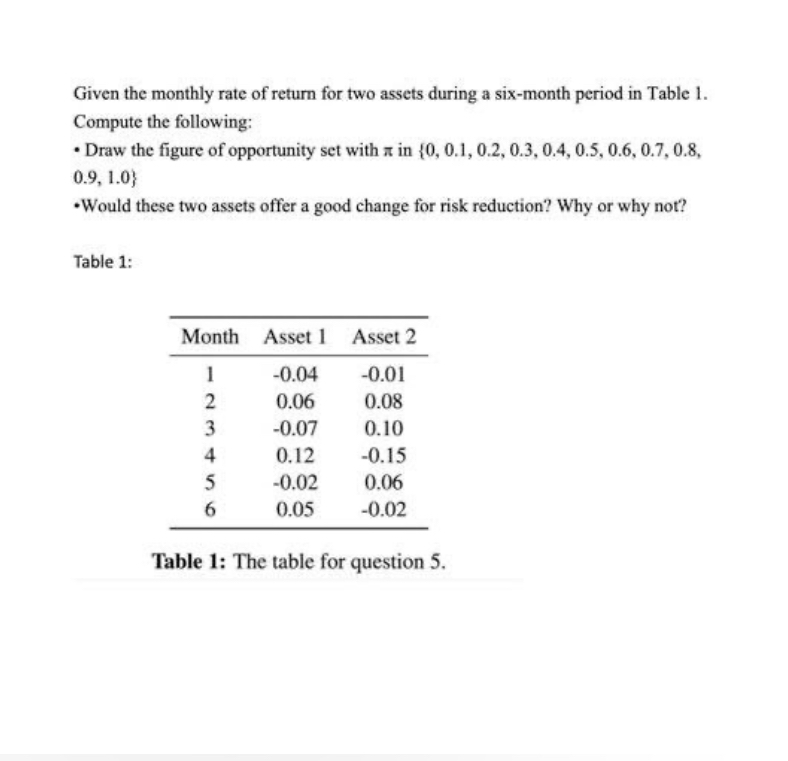
image text in transcribed

Given the monthly rate of return for two assets during a six-month period in Table 1. Compute the following: Draw the figure of opportunity set with in {0, 0.1, 0.2, 0.3, 0.4, 0.5, 0.6, 0.7, 0.8, 0.9, 1.0) Would these two assets offer a good change for risk reduction? Why or why not? Table 1: Month Asset1 Asset 2 -0.01 0.08 1 2 3 4 5 6 -0.04 0.06 -0.07 0.12 -0.02 0.05 0.10 -0.15 0.06 -0.02 Table 1: The table for question 5

Step by Step Solution

There are 3 Steps involved in it

Step: 1

blur-text-image

Get Instant Access to Expert-Tailored Solutions

See step-by-step solutions with expert insights and AI powered tools for academic success

Step: 2

blur-text-image_2

Step: 3

blur-text-image_3

Ace Your Homework with AI

Get the answers you need in no time with our AI-driven, step-by-step assistance

Get Started

Recommended Textbook for

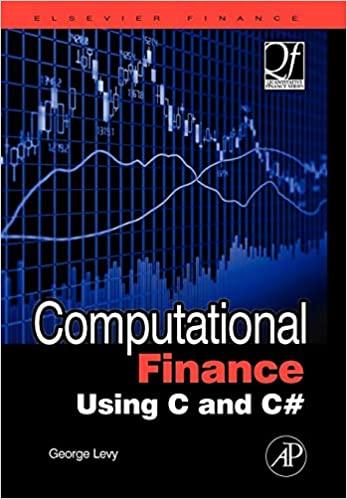
Computational Finance Using C And C #

Authors: George Levy DPhil University Of Oxford

1st Edition

0750669195, 978-0750669191

More Books

Students also viewed these Finance questions