

Answered step by step
Verified Expert Solution
Question
1 Approved Answer
Given the ROI calculations would you invest in the IT infrastructure? Why and why not What concerns would you have given the indirect benefits compared
 Given the ROI calculations would you invest in the IT infrastructure? Why and why not
What concerns would you have given the indirect benefits compared to the direct benefits?
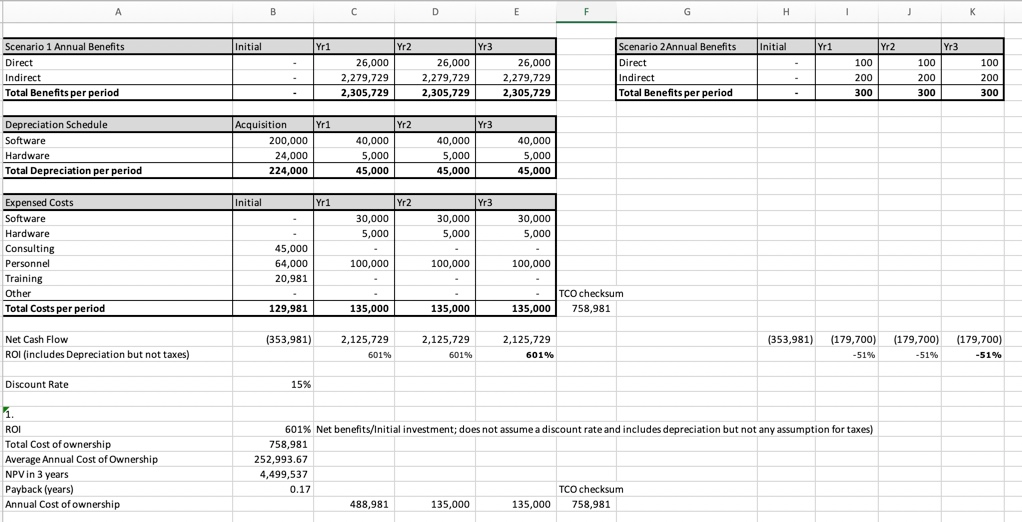
A B D E H 1 J J Initial Yr1 Yr2 Yr3 Initial Yri Yr2 Yr3 - 100 Scenario 1 Annual Benefits Direct Indirect Total Benefits per period 26,000 2,279,729 2,305,729 26,000 2,279,729 2,305,729 26,000 2,279,729 2,305,729 Scenario 2 Annual Benefits Direct Indirect Total Benefits per period 100 200 300 200 300 100 200 300 Yr1 Yr2 Depreciation Schedule Software Hardware Total Depreciation per period Acquisition 200,000 24,000 224,000 40,000 5,000 45,000 Yr3 40,000 5,000 45,000 40,000 5,000 45,000 Initial Yr1 Yr3 Yr2 30,000 5,000 30,000 5,000 30,000 5,000 Expensed Costs Software Hardware Consulting Personnel Training Other Total Costs per period 45,000 64,000 20,981 100.000 100,000 100,000 TCO checksum 758,981 129,981 135,000 135,000 135,000 (353,981) (353,981) Net Cash Flow ROI (includes Depreciation but not taxes) 2,125,729 601% 2,125,729 601% 2,125,729 601% (179,700) -51% (179,700) -51% (179,700) -51% Discount Rate 15% 1. ROI Total Cost of ownership Average Annual Cost of Ownership NPV in 3 years Payback (years) Annual Cost of ownership 601% Net benefits/Initial investment; does not assume a discount rate and includes depreciation but not any assumption for taxes) 758,981 252,993.67 4,499,537 0.17 TCO checksum 488,981 135,000 135,000 758.981 A B D E H 1 J J Initial Yr1 Yr2 Yr3 Initial Yri Yr2 Yr3 - 100 Scenario 1 Annual Benefits Direct Indirect Total Benefits per period 26,000 2,279,729 2,305,729 26,000 2,279,729 2,305,729 26,000 2,279,729 2,305,729 Scenario 2 Annual Benefits Direct Indirect Total Benefits per period 100 200 300 200 300 100 200 300 Yr1 Yr2 Depreciation Schedule Software Hardware Total Depreciation per period Acquisition 200,000 24,000 224,000 40,000 5,000 45,000 Yr3 40,000 5,000 45,000 40,000 5,000 45,000 Initial Yr1 Yr3 Yr2 30,000 5,000 30,000 5,000 30,000 5,000 Expensed Costs Software Hardware Consulting Personnel Training Other Total Costs per period 45,000 64,000 20,981 100.000 100,000 100,000 TCO checksum 758,981 129,981 135,000 135,000 135,000 (353,981) (353,981) Net Cash Flow ROI (includes Depreciation but not taxes) 2,125,729 601% 2,125,729 601% 2,125,729 601% (179,700) -51% (179,700) -51% (179,700) -51% Discount Rate 15% 1. ROI Total Cost of ownership Average Annual Cost of Ownership NPV in 3 years Payback (years) Annual Cost of ownership 601% Net benefits/Initial investment; does not assume a discount rate and includes depreciation but not any assumption for taxes) 758,981 252,993.67 4,499,537 0.17 TCO checksum 488,981 135,000 135,000 758.981Step by Step Solution
There are 3 Steps involved in it
Step: 1

Get Instant Access to Expert-Tailored Solutions
See step-by-step solutions with expert insights and AI powered tools for academic success
Step: 2

Step: 3
Ace Your Homework with AI
Get the answers you need in no time with our AI-driven, step-by-step assistance
Get Started
Finance For Normal People
Authors: Meir Statman
1st Edition
019062647X, 978-0190626471