Answered step by step
Verified Expert Solution
Question
1 Approved Answer
Given the series of demand data below DpictureClick here for the Excel Data File a. Calculate the forecasts for periods 7 through 11 using moving
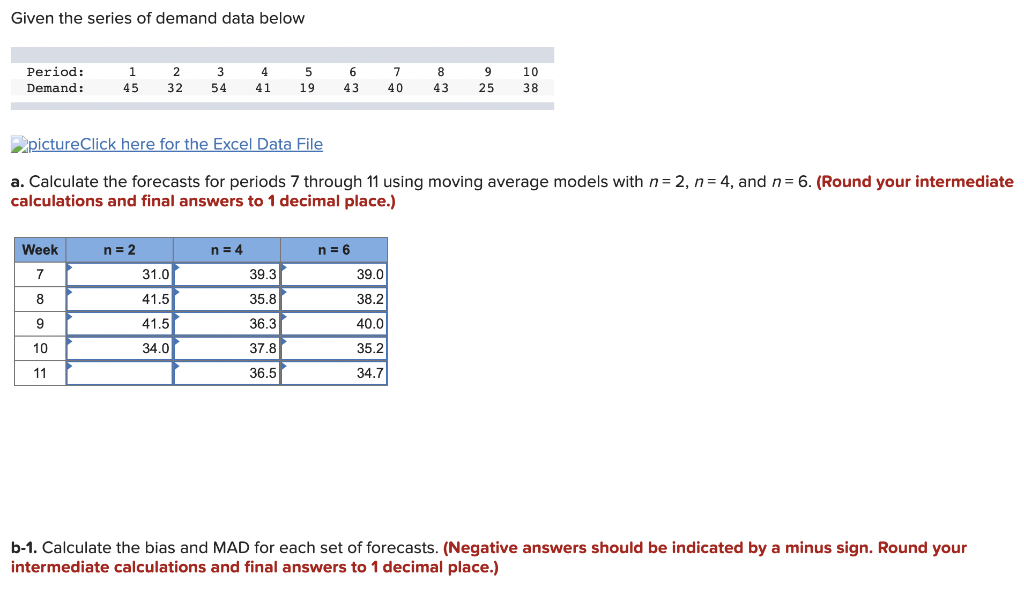
Given the series of demand data below DpictureClick here for the Excel Data File a. Calculate the forecasts for periods 7 through 11 using moving average models with n=2,n=4, and n=6. (Round your intermediate calculations and final answers to 1 decimal place.) b-1. Calculate the bias and MAD for each set of forecasts. (Negative answers should be indicated by a minus sign. Round your intermediate calculations and final answers to 1 decimal place.) b-1. Calculate the bias and MAD for each set of forecasts. (Negative answers should be indicated by a minus sign. Round your intermediate calculations and final answers to 1 decimal place.)
Step by Step Solution
There are 3 Steps involved in it
Step: 1
Get Instant Access to Expert-Tailored Solutions
See step-by-step solutions with expert insights and AI powered tools for academic success
Step: 2
Step: 3
Ace Your Homework with AI
Get the answers you need in no time with our AI-driven, step-by-step assistance
Get Started