 Glenna Inc. operates a chain of snack shops. The company is considering two possible expansion plans. Plan A would open eight smaller shops at a cost of $8,840,000. Expected annual net cash inflows are $1,800,000 with zero residual value at the end of ten years. Under Plan B, Glenna would open three larger shops at a cost of $8,140,000. This plan is expected to generate net cash inflows of $1,500,000 per year for ten years, the estimated life of the properties. Estimated residual value is $925,000. Glenna uses straight-line depreciation and requires an annual return of 6%
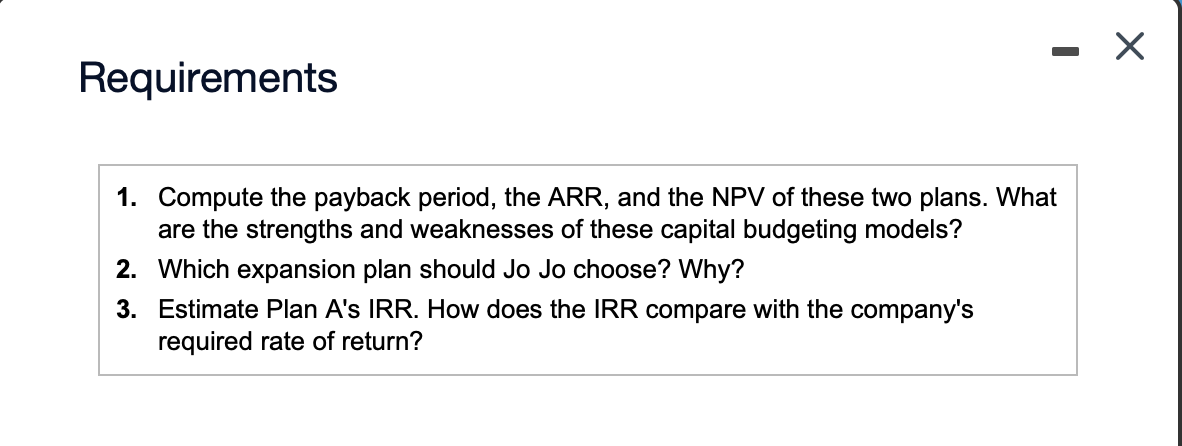
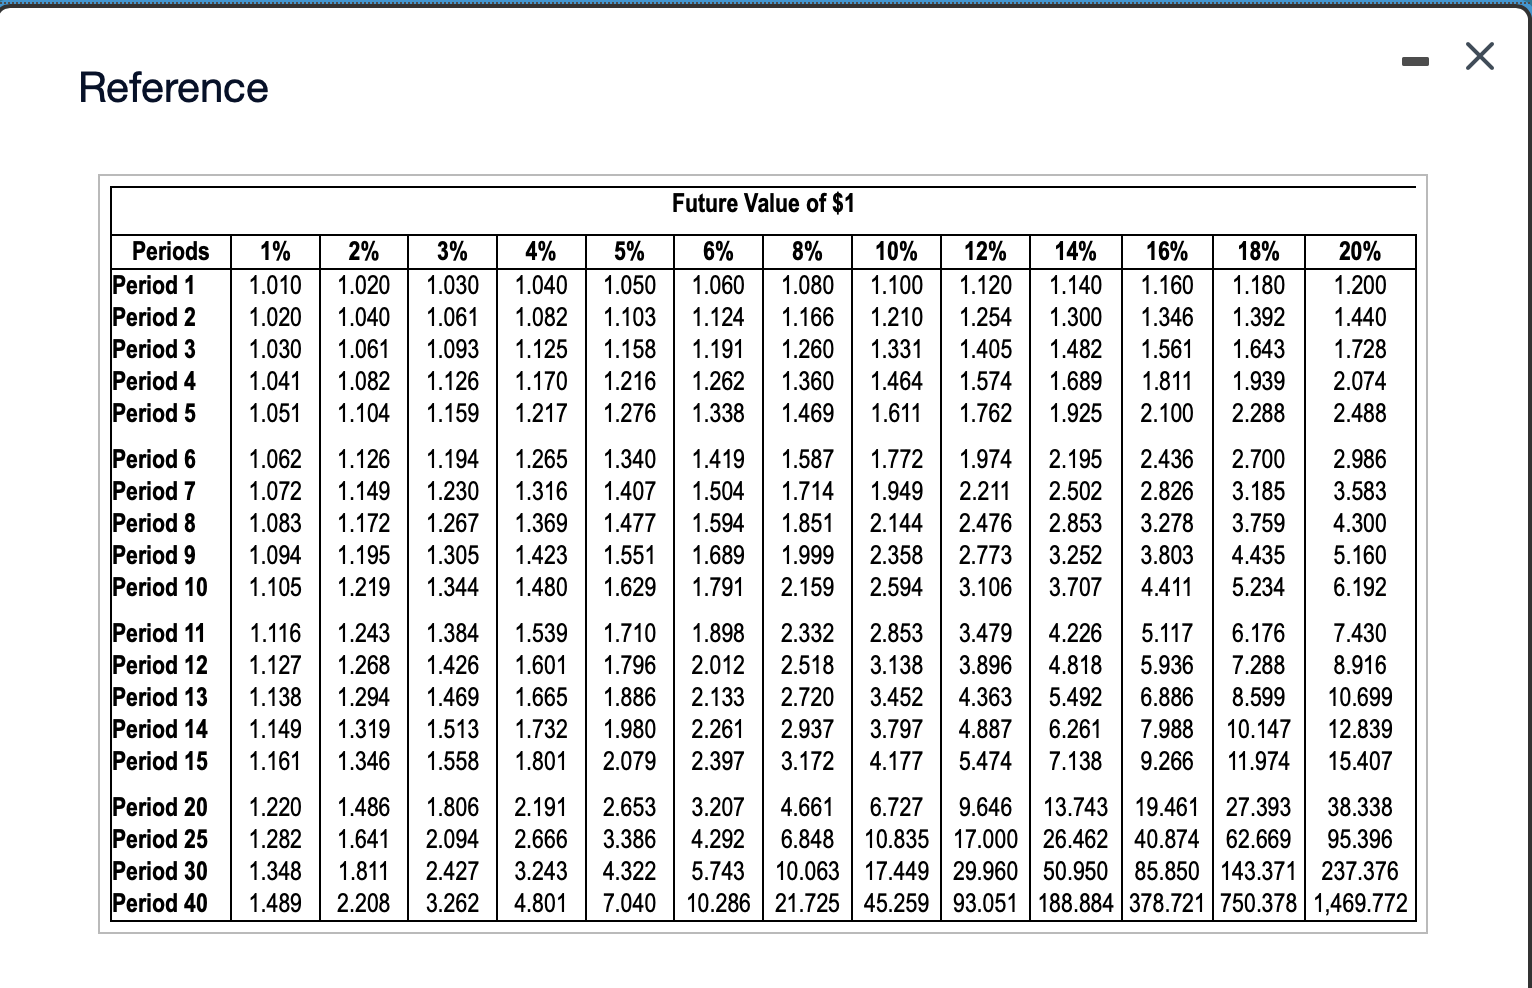
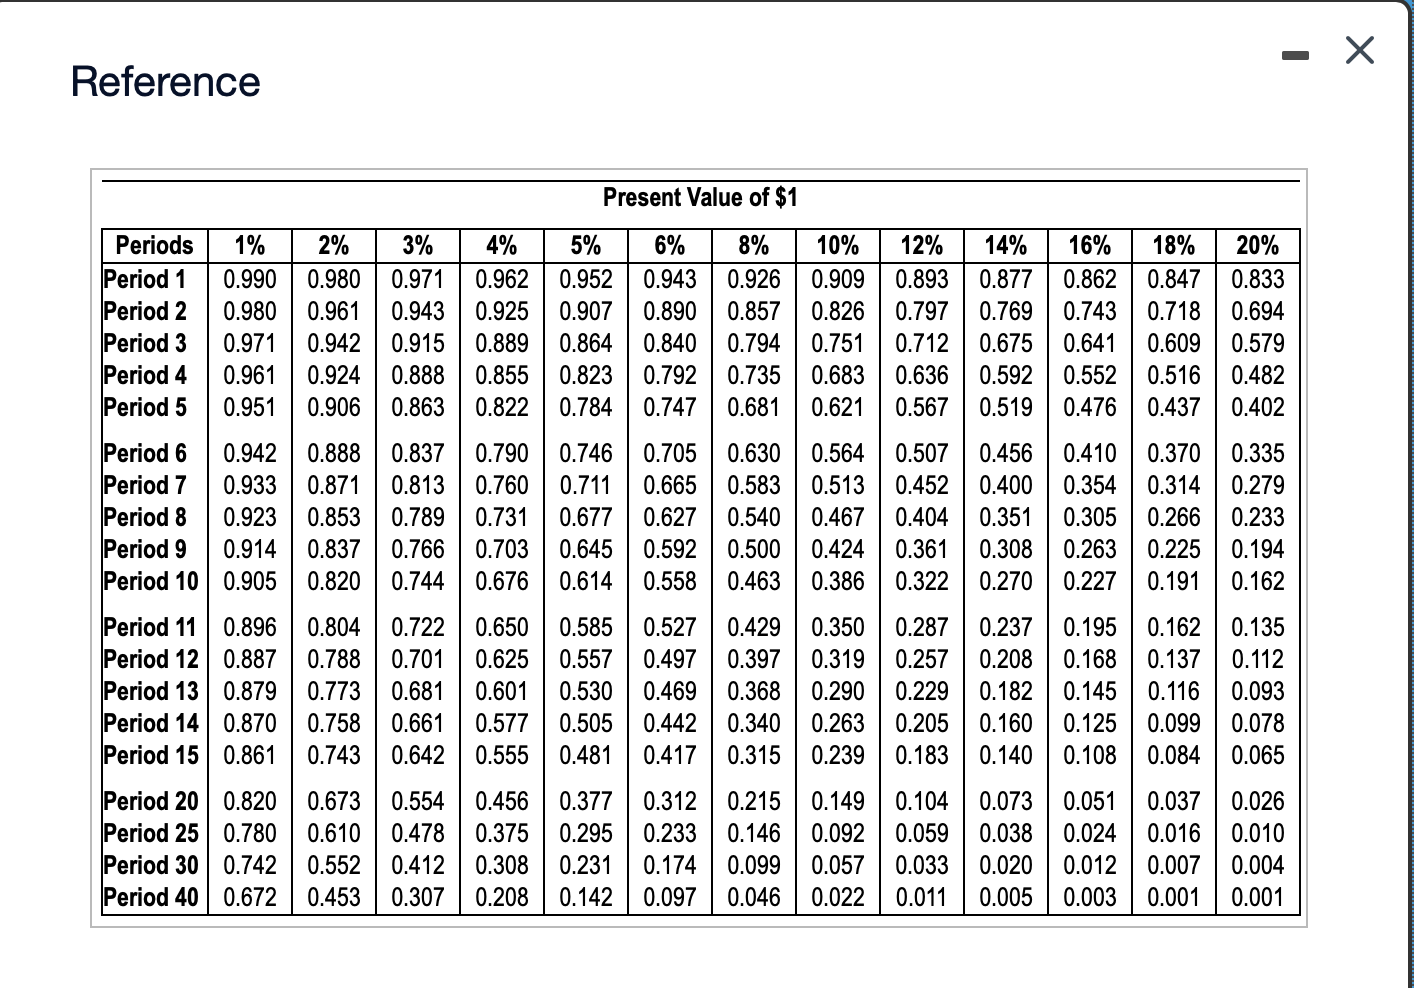
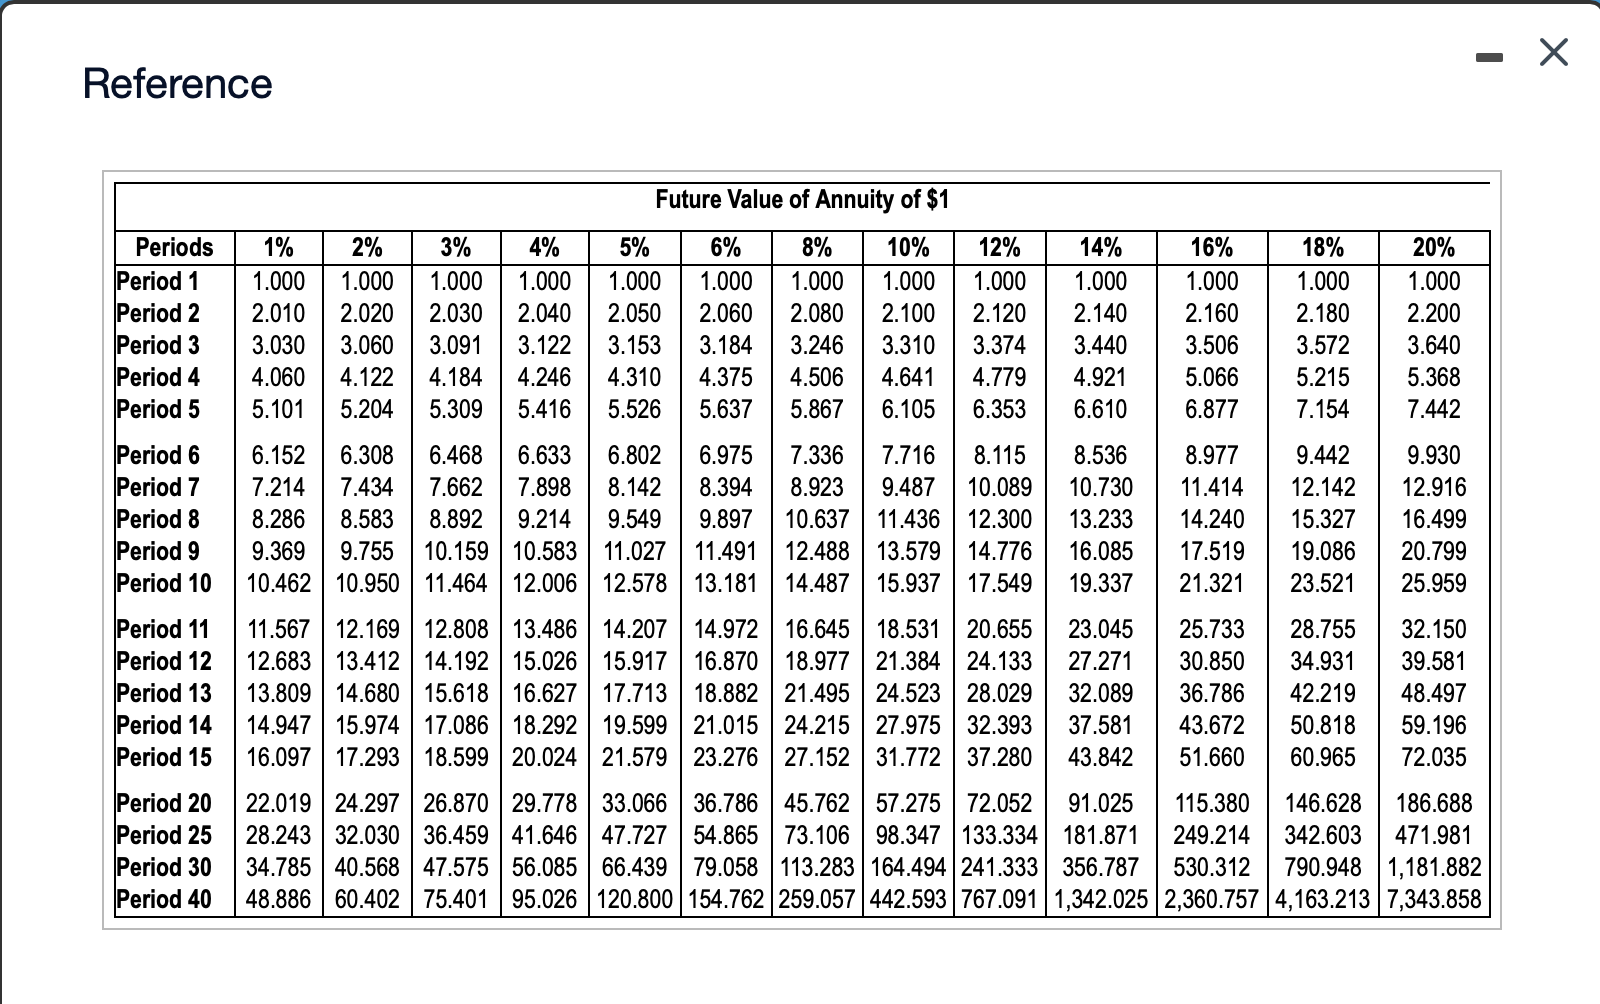
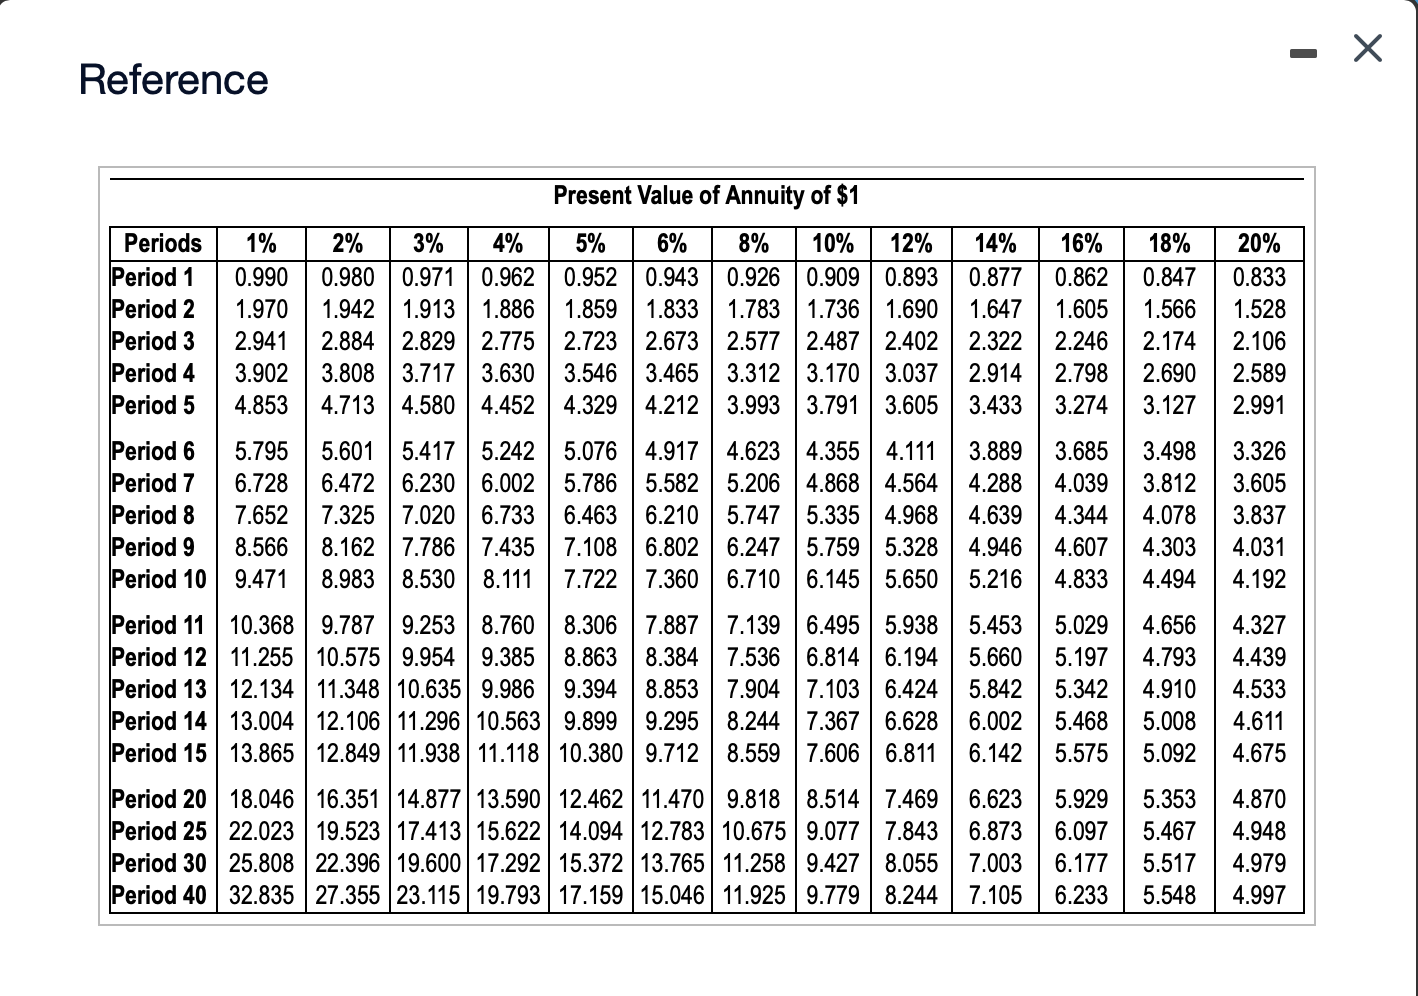
Reference Periods Period 1 Period 2 Period 3 Period 4 Period 5 Period 6 Period 7 Period 8 Period 9 Period 10 Period 11 Period 12 Period 13 Period 14 Period 15 Period 20 Period 25 Period 30 Period 40 - X Future Value of $1 14% 16% 18% 20% 1% 2% 3% 1.010 1.020 1.030 1.020 1.040 1.061 1.180 1.200 1.440 5% 6% 8% 10% 12% 1.050 1.060 1.080 1.100 1.120 1.140 1.160 1.124 1.166 1.210 1.254 1.300 1.346 1.392 1.191 1.260 1.331 1.405 1.482 1.561 1.643 1.262 1.360 1.464 1.574 1.689 1.811 1.939 1.338 1.469 1.611 1.762 1.925 2.100 2.288 1.030 1.061 1.093 1.728 2.074 2.488 4% 1.040 1.082 1.103 1.125 1.158 1.041 1.082 1.126 1.170 1.216 1.051 1.104 1.159 1.217 1.276 1.062 1.126 1.194 1.265 1.340 1.419 1.587 1.772 1.974 2.195 2.436 2.700 1.072 1.149 1.230 1.316 1.407 1.504 1.714 1.949 2.211 2.502 2.826 3.185 1.083 1.172 1.267 1.369 1.477 1.594 1.851 2.144 2.476 2.853 3.278 3.759 1.094 1.195 1.305 1.423 1.551 1.689 1.999 2.358 2.773 3.252 3.803 4.435 1.105 1.219 1.344 1.480 1.629 1.791 2.594 3.106 3.707 4.411 5.234 1.898 2.332 2.986 3.583 4.300 5.160 2.159 6.192 1.116 1.243 1.384 1.539 1.710 6.176 7.430 2.853 3.479 4.226 2.518 3.138 3.896 4.818 5.117 5.936 7.288 1.127 1.268 1.426 1.601 1.796 2.012 8.916 1.138 1.294 1.469 1.665 1.886 2.133 2.720 3.452 4.363 5.492 6.886 8.599 10.699 1.149 1.319 1.513 1.732 1.980 2.261 6.261 7.988 10.147 12.839 1.161 1.346 1.558 1.801 2.079 2.397 4.177 5.474 7.138 9.266 11.974 15.407 1.220 38.338 1.486 1.641 1.348 1.811 2.937 3.797 4.887 3.172 1.806 2.191 2.653 3.207 4.661 6.727 9.646 13.743 19.461 27.393 2.094 2.666 3.386 4.292 6.848 10.835 17.000 26.462 40.874 62.669 2.427 3.243 4.322 5.743 10.063 17.449 29.960 50.950 85.850 143.371 237.376 1.489 2.208 3.262 4.801 7.040 10.286 21.725 45.259 93.051 188.884 378.721 750.378 1,469.772 1.282 95.396 Reference Present Value of $1 Periods 4% 5% 6% 8% 10% 12% 14% 16% 18% 20% 1% Period 1 0.990 0.980 2% 3% 0.971 0.962 0.952 0.943 0.925 0.907 0.926 0.909 0.893 0.877 0.862 0.847 0.833 0.943 0.890 0.857 Period 2 0.980 0.961 0.826 0.797 0.769 0.743 0.718 0.694 Period 3 0.971 0.942 0.915 0.889 0.864 0.840 0.794 0.751 0.712 0.675 0.641 0.609 0.579 Period 4 0.961 0.924 0.888 0.855 0.823 0.683 0.636 0.516 0.482 0.592 0.552 0.567 0.519 0.476 0.437 Period 5 0.951 0.906 0.863 0.621 0.402 Period 6 0.942 0.888 0.837 0.790 0.410 0.370 0.335 Period 7 0.933 0.792 0.735 0.822 0.784 0.747 0.681 0.746 0.705 0.630 0.871 0.813 0.760 0.711 0.665 0.583 0.853 0.789 0.731 0.677 0.627 0.540 0.500 0.463 0.564 0.507 0.456 0.513 0.452 0.400 0.354 0.314 0.279 0.404 0.351 0.305 0.266 0.233 0.361 0.308 0.263 0.225 Period 8 0.923 0.467 Period 9 0.766 0.703 0.645 0.592 0.194 0.424 0.386 0.322 0.270 0.227 0.191 0.676 0.614 0.558 0.162 0.914 0.837 Period 10 0.905 Period 11 0.896 0.804 Period 12 Period 13 0.879 0.820 0.744 0.722 0.887 0.788 0.701 0.773 0.650 0.585 0.135 0.625 0.557 0.112 0.681 0.093 Period 14 0.870 0.758 0.661 0.577 0.078 0.527 0.429 0.350 0.287 0.237 0.195 0.162 0.497 0.397 0.319 0.257 0.208 0.168 0.137 0.601 0.530 0.469 0.368 0.290 0.229 0.182 0.145 0.116 0.505 0.442 0.340 0.263 0.205 0.160 0.125 0.099 0.481 0.417 0.315 0.239 0.183 0.140 0.108 0.084 0.820 0.673 0.554 0.456 0.377 0.312 0.215 0.149 0.104 0.073 0.051 0.037 0.780 0.610 0.478 0.375 0.295 0.233 0.146 0.092 0.059 0.038 0.024 0.016 0.010 Period 30 0.742 0.552 0.412 0.308 0.231 0.174 0.099 0.057 0.033 0.020 0.012 0.007 0.004 Period 40 0.672 0.453 0.307 0.208 0.142 0.097 0.046 0.022 0.011 0.005 Period 15 0.861 0.743 0.642 0.555 0.065 Period 20 0.026 Period 25 0.003 0.001 0.001 X Reference Periods Period 1 Period 2 Period 3 Period 4 Period 5 Period 6 Period 7 Period 8 Period 9 Period 10 Period 11 Period 12 Period 13 Period 14 Period 15 Period 20 Period 25 Period 30 Period 40 Future Value of Annuity of $1 1% 4% 5% 6% 8% 10% 12% 14% 16% 18% 20% 1.000 1.000 1.000 1.000 1.000 1.000 1.000 1.000 2% 3% 1.000 1.000 2.030 2.040 2.050 3.091 3.122 3.153 3.184 4.122 4.184 4.246 4.310 4.375 1.000 1.000 1.000 2.060 2.080 2.100 2.120 2.010 2.020 2.140 2.160 2.180 2.200 3.030 3.060 3.506 3.572 3.640 4.060 5.066 5.215 5.368 5.101 5.204 5.309 5.416 5.526 5.637 6.877 7.154 7.442 6.152 6.308 6.468 6.633 6.802 6.975 9.930 7.214 7.434 7.662 7.898 12.916 8.286 8.583 8.892 16.499 8.142 8.394 9.214 9.549 9.897 9.369 9.755 10.159 10.583 11.027 11.491 10.462 10.950 11.464 12.006 12.578 13.181 3.246 3.310 3.374 3.440 4.506 4.641 4.779 4.921 5.867 6.105 6.353 6.610 7.336 7.716 8.115 8.536 8.977 9.442 8.923 9.487 10.089 10.730 11.414 12.142 10.637 11.436 12.300 13.233 14.240 15.327 12.488 13.579 14.776 16.085 17.519 19.086 20.799 14.487 15.937 17.549 19.337 21.321 23.521 25.959 11.567 12.169 12.808 13.486 14.207 14.972 16.645 18.531 20.655 23.045 25.733 28.755 32.150 12.683 13.412 14.192 15.026 15.917 16.870 18.977 21.384 24.133 27.271 30.850 34.931 39.581 13.809 14.680 15.618 16.627 17.713 18.882 21.495 24.523 28.029 32.089 36.786 42.219 48.497 14.947 15.974 17.086 18.292 19.599 21.015 24.215 27.975 32.393 37.581 43.672 50.818 59.196 16.097 17.293 18.599 20.024 21.579 23.276 27.152 31.772 37.280 43.842 51.660 60.965 22.019 24.297 26.870 29.778 33.066 36.786 45.762 57.275 72.052 91.025 115.380 146.628 186.688 28.243 32.030 36.459 41.646 47.727 54.865 73.106 98.347 133.334 181.871 249.214 342.603 471.981 34.785 40.568 47.575 56.085 66.439 79.058 113.283 164.494 241.333 356.787 530.312 790.948 1,181.882 48.886 60.402 75.401 95.026 120.800 154.762 259.057 442.593 767.091 1,342.025 2,360.757 4,163.213 7,343.858 72.035 X Reference Present Value of Annuity of $1 Periods 14% 16% 18% 20% 1% 2% 3% 4% Period 1 0.990 0.980 0.971 0.962 10% 12% 0.909 | 0.893 0.877 0.847 0.833 0.862 1.605 1.566 1.528 Period 2 1.970 1.942 1.647 5% 6% 8% 0.952 0.943 0.926 1.913 1.886 1.859 1.833 1.783 1.736 1.690 2.829 2.775 2.723 2.673 2.577 2.487 2.402 2.322 3.808 3.717 3.630 3.546 3.465 3.312 3.170 3.037 2.914 4.713 4.580 4.452 4.329 4.212 3.993 3.791 3.605 Period 3 2.941 2.884 2.246 2.174 2.106 Period 4 3.902 2.798 2.690 2.589 Period 5 4.853 3.433 3.274 3.127 2.991 Period 6 3.685 3.498 3.326 Period 7 3.605 6.728 7.652 Period 8 3.837 Period 9 8.566 8.162 4.031 Period 10 9.471 8.983 8.530 8.111 4.192 4.327 4.439 5.795 5.601 5.417 5.242 5.076 4.917 4.623 4.355 4.111 3.889 6.472 6.230 6.002 5.786 5.582 5.206 4.868 4.564 4.288 4.039 3.812 7.325 7.020 6.733 6.463 6.210 5.747 5.335 4.968 4.639 4.344 4.078 7.786 7.435 7.108 6.802 6.247 5.759 5.328 4.946 4.607 4.303 7.722 7.360 6.710 6.145 5.650 5.216 4.833 4.494 Period 11 10.368 9.787 9.253 8.760 8.306 7.887 7.139 6.495 5.938 5.453 5.029 4.656 Period 12 11.255 10.575 9.954 9.385 8.863 8.384 7.536 6.814 6.194 5.660 5.197 4.793 12.134 11.348 10.635 9.986 9.394 8.853 7.904 7.103 6.424 5.842 5.342 4.910 13.004 12.106 11.296 10.563 9.899 9.295 8.244 7.367 6.628 6.002 5.468 5.008 13.865 12.849 11.938 11.118 10.380 9.712 8.559 7.606 6.811 6.142 5.575 5.092 Period 20 18.046 16.351 14.877 13.590 | 12.462 | 11.470 9.818 8.514 7.469 Period 25 22.023 19.523 17.413 15.622 14.094 12.783 10.675 9.077 7.843 6.873 Period 30 25.808 22.396 19.600 17.292 15.372 13.765 11.258 9.427 8.055 7.003 Period 40 32.835 27.355 23.115 19.793 17.159 15.046 11.925 9.779 8.244 7.105 Period 13 4.533 4.611 Period 14 Period 15 4.675 6.623 5.929 5.353 4.870 6.097 5.467 4.948 6.177 5.517 4.979 6.233 5.548 4.997 X Requirements 1. Compute the payback period, the ARR, and the NPV of these two plans. What are the strengths and weaknesses of these capital budgeting models? 2. Which expansion plan should Jo Jo choose? Why? 3. Estimate Plan A's IRR. How does the IRR compare with the company's required rate of return