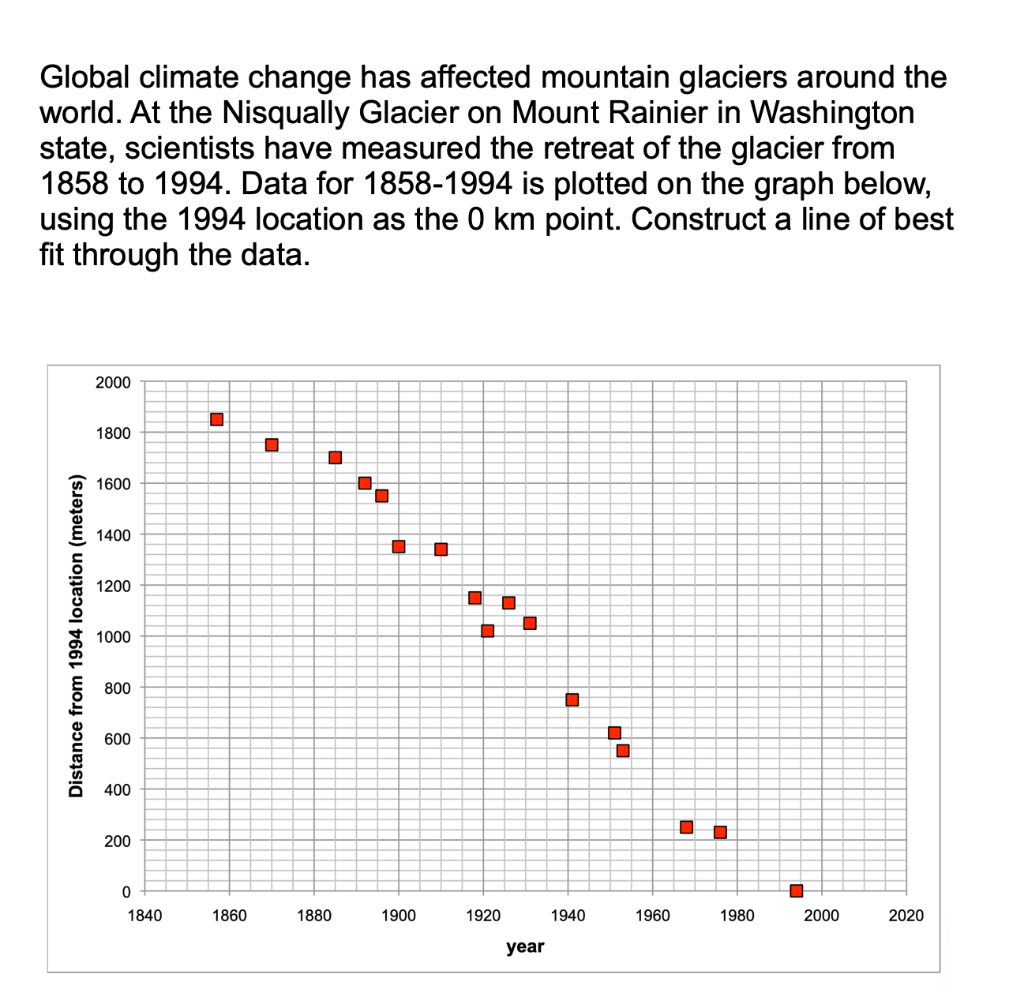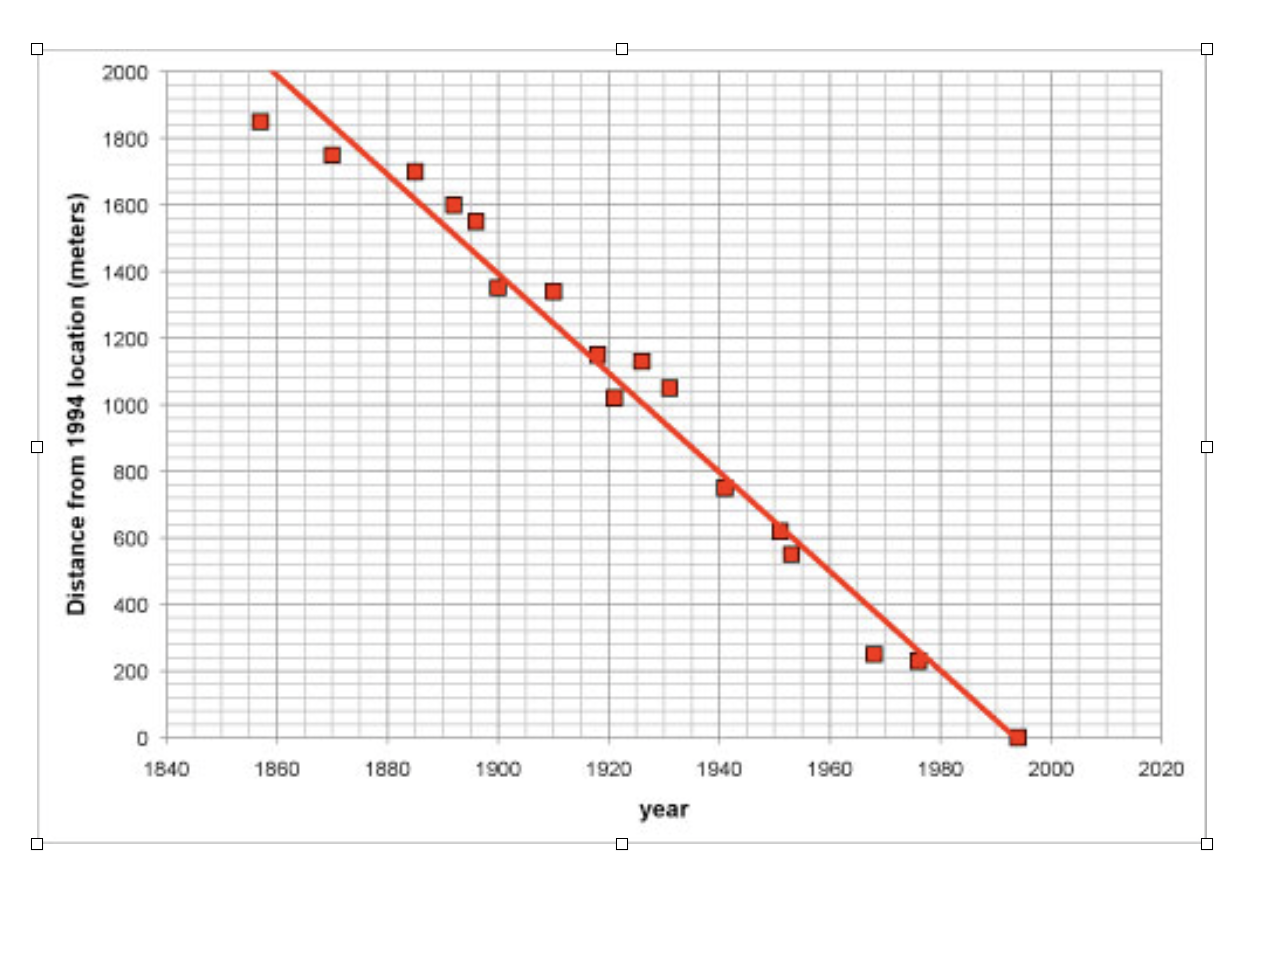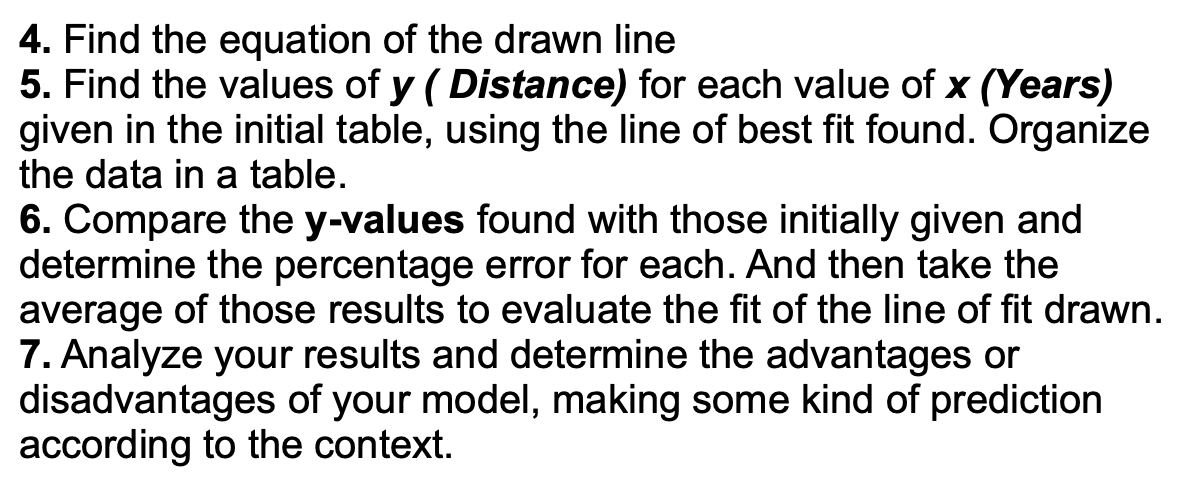


Global climate change has affected mountain glaciers around the world. At the Nisqually Glacier on Mount Rainier in Washington state, scientists have measured the retreat of the glacier from 1858 to 1994. Data for 1858-1994 is plotted on the graph below, using the 1994 location as the 0 km point. Construct a line of best fit through the data. 2000 1800 1600 1400 O 1 1200 Distance from 1994 location (meters) 1000 800 . 600 400 200 0 1840 1860 1880 1900 1920 1940 1960 1980 2000 2020 year 2000 1800 1600 1400 1200 Distance from 1994 location (meters) 1000 800 600 400 200 0 1840 1860 1880 1900 1920 1940 1960 1980 2000 2020 year 4. Find the equation of the drawn line 5. Find the values of y( Distance) for each value of x (Years) given in the initial table, using the line of best fit found. Organize the data in a table. 6. Compare the y-values found with those initially given and determine the percentage error for each. And then take the average of those results to evaluate the fit of the line of fit drawn. 7. Analyze your results and determine the advantages or disadvantages of your model, making some kind of prediction according to the context. Global climate change has affected mountain glaciers around the world. At the Nisqually Glacier on Mount Rainier in Washington state, scientists have measured the retreat of the glacier from 1858 to 1994. Data for 1858-1994 is plotted on the graph below, using the 1994 location as the 0 km point. Construct a line of best fit through the data. 2000 1800 1600 1400 O 1 1200 Distance from 1994 location (meters) 1000 800 . 600 400 200 0 1840 1860 1880 1900 1920 1940 1960 1980 2000 2020 year 2000 1800 1600 1400 1200 Distance from 1994 location (meters) 1000 800 600 400 200 0 1840 1860 1880 1900 1920 1940 1960 1980 2000 2020 year 4. Find the equation of the drawn line 5. Find the values of y( Distance) for each value of x (Years) given in the initial table, using the line of best fit found. Organize the data in a table. 6. Compare the y-values found with those initially given and determine the percentage error for each. And then take the average of those results to evaluate the fit of the line of fit drawn. 7. Analyze your results and determine the advantages or disadvantages of your model, making some kind of prediction according to the context


