Answered step by step
Verified Expert Solution
Question
1 Approved Answer
Global Defender manufactures radar systems. It has just completed the manufacture of its first newly designed system, RS-32. Manufacturing data for the RS-32 follow:


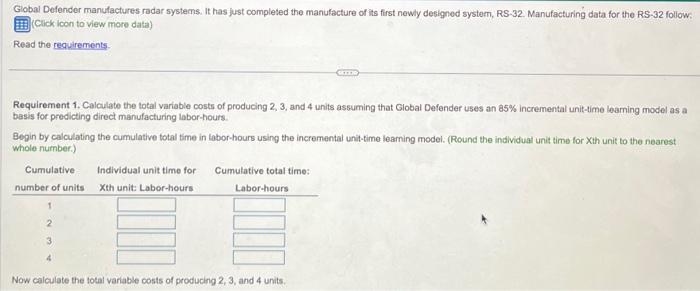
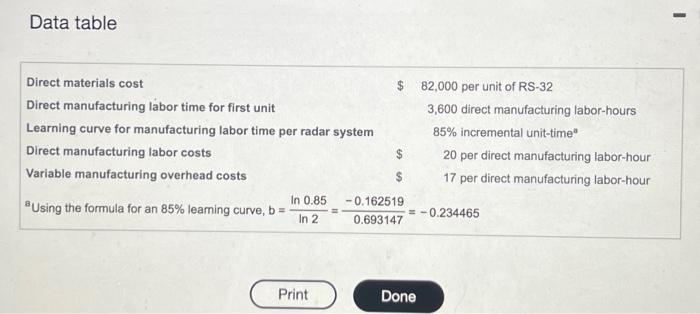
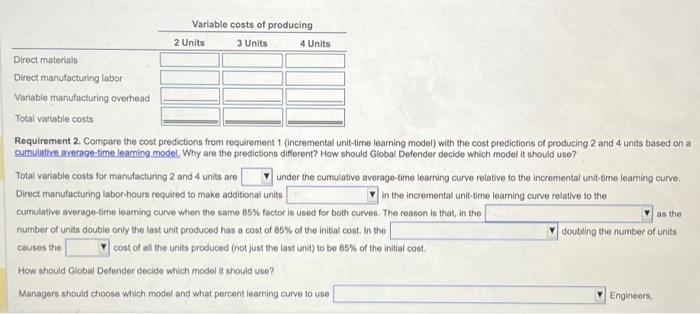
Global Defender manufactures radar systems. It has just completed the manufacture of its first newly designed system, RS-32. Manufacturing data for the RS-32 follow: (Click icon to view more data) Read the requirements Requirement 1. Calculate the total variable costs of producing 2, 3, and 4 units assuming that Global Defender uses an 85% incremental unit-time learning model as a basis for predicting direct manufacturing labor-hours. Begin by calculating the cumulative total time in labor-hours using the incremental unit-time learning model. (Round the individual unit time for Xth unit to the nearest whole number.) Cumulative number of units 1 2 Individual unit time for Xth unit: Labor-hours GITES Cumulative total time: Labor-hours Now calculate the total variable costs of producing 2, 3, and 4 units. Data table Direct materials cost Direct manufacturing labor time for first unit Learning curve for manufacturing labor time per radar system Direct manufacturing labor costs Variable manufacturing overhead costs Using the formula for an 85% learning curve, b = In 0.85 In 2 Print $ 82,000 per unit of RS-32 -0.162519 0.693147 3,600 direct manufacturing labor-hours 85% incremental unit-time" 20 per direct manufacturing labor-hour 17 per direct manufacturing labor-hour = -0.234465 Done I Variable costs of producing 3 Units 2 Units 4 Units Direct materials Direct manufacturing labor Variable manufacturing overhead Total variable costs Requirement 2. Compare the cost predictions from requirement 1 (incremental unit-time learning model) with the cost predictions of producing 2 and 4 units based on a cumulative average-time learning model. Why are the predictions different? How should Global Defender decide which model it should use? Total variable costs for manufacturing 2 and 4 units are under the cumulative average-time learning curve relative to the incremental unit-time learning curve. Direct manufacturing labor-hours required to make additional units in the incremental unit-time learning curve relative to the cumulative average-time learning curve when the same 85% factor is used for both curves. The reason is that, in the number of units double only the last unit produced has a cost of 85% of the initial cost. In the causes the cost of all the units produced (not just the last unit) to be 85% of the initial cost. How should Global Defender decide which model it should use? Managers should choose which model and what percent learning curve to use as the doubling the number of units Engineers, Requirement 2. Compare the cost predictions from requirement 1 (incremental unit-time leaming model) with the cost predictions of producing 2 and 4 units based on a cumulative average-time leaming model. Why are the predictions different? How should Global Defender decide which model it should use? Total variable costs for manufacturing 2 and 4 units are under the cumulative average-time learning curve relative to the incremental unit-time learning curve Direct manufacturing labor-hours required to make additional units in the incremental unit-time leaming curve relative to the cumulative average-time leaming curve when the same 85% factor is used for both curves. The reason is that, in the number of units double only the last unit produced has a cost of 85% of the initial cost. In the causes the cost of all the units produced (not just the last unit) to be 85% of the initial cost. How should Global Defender decide which model it should use? Managers should choose which model and what percent leaming curve to use plant managers, and workers model that best fits the data as the doubling the number of units Engineers, of information on the amount and type of leaming actually occurring. Plotting this information and estimating the helpful to Global Defender when selecting the appropriate model.
Step by Step Solution
★★★★★
3.39 Rating (152 Votes )
There are 3 Steps involved in it
Step: 1
Here is a comparison of the cost predictions from the empirical model and the learning curve model Model Empirical model Learning curve model Cost pre...
Get Instant Access to Expert-Tailored Solutions
See step-by-step solutions with expert insights and AI powered tools for academic success
Step: 2

Step: 3

Ace Your Homework with AI
Get the answers you need in no time with our AI-driven, step-by-step assistance
Get Started


