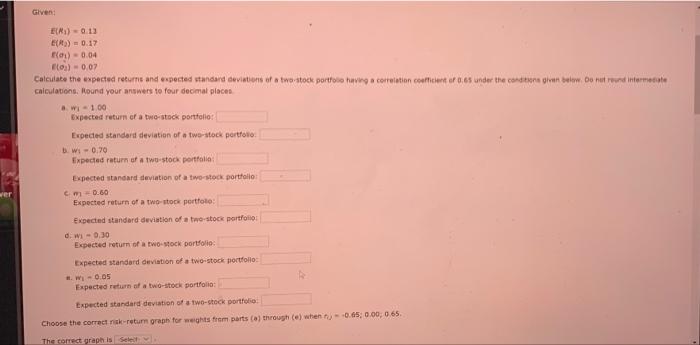
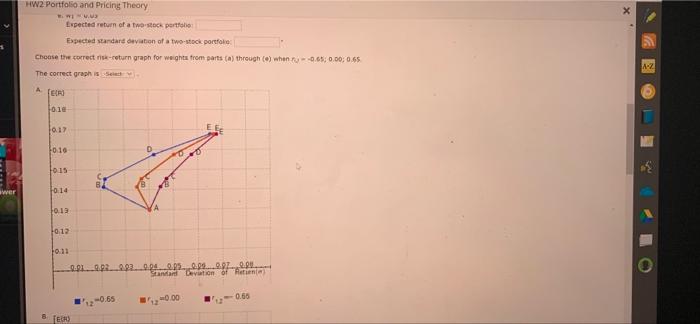
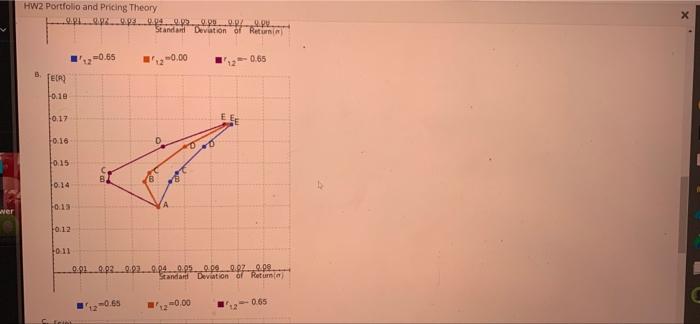
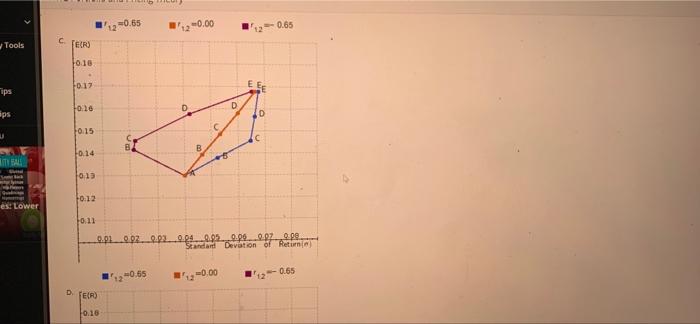
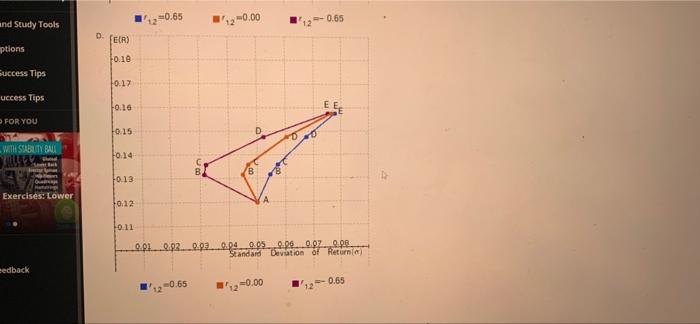
Glven E(R)-0.13 ER) = 0.17 -0.04 (0) - 0,07 Calculate the expected returns and expected standard deviations of a two-stock portfoto having a correlation coefficient of 0.65 under the condition below. Do not und intermediate calculations, Round your answers to four decimal places W-100 Expected return of a two-stock portfolio Expected standard deviation of a two-stock portfolio Wi-0.70 Expected return of a two-stock portfolio Expected standard deviation of a two-stock portfolio cm -0.60 Expected return of a two-stock portfolio Expected standard deviation of a two-stock portfolio dwi - 0.30 Expected return of a two-stock portfolio wer Expected standard deviation of a two-stock portfolio Wi-0.05 Expected return of a two-stock portfolio Expected standard deviation of two-stock portfolio Choose the correct risk-return graphs for weights from parts (a) through (e) when 0.65 0.00065. The correct graph is Selena X HW2 Portfolio and Pricing Theory WWW. Expected return of a two-stock portfolio Expected standard deviation of a two-stock portfolio Choose the correct risk-return graph for weights from parts() through () when -0.650.00 0.65 A-Z The correct graphische ER 0.10 0.17 EEE 0.10 10:15 wer 10:14 0.12 10.12 F011 0.01.2.2_092...004025 0.0....0.97.. Station of -0.65 -0.00 0.60 8 TECH) HW2 Portfolio and Pricing Theory 2.2.4.3......029.99...20 Standard Devation of Return X -0.65 0.00 0.65 B TER 0.10 0.17 0.16 0.15 0.14 F0:13 wer 10.12 0.11 0.919.020.02...094.005_0.09 0.022.09 Standart Deviation of Return 12 -0.65 -0.00 -0.65 b 0.65 '12 -0.00 -0.65 Tools C. TEIRO 0.10 F0:17 EES ips D 0.16 aps D 0.15 U 10.14 1013 G F0:12 es: Lower 0.11 0.01 0.022_0.00_0.24 0.250.00...0.070.pe Standard Devation of Retur -0.65 -0.00 -0.65 D ER) 10.16 -0.65 -0.00 -0.65 and Study Tools iptions D TER) F0.10 Success Tips 0.17 uccess Tips Fo.16 FOR YOU 0.15 S WITH STABILITY BALL 10.14 Um 6 +0.13 Exercises: Lower 10.12 0.11 0.01.2.92.0.03 0.04 0.05 0.00 0.07 0.08 Standard Devation of Return eedback -0.65 -0.00 0.65 Glven E(R)-0.13 ER) = 0.17 -0.04 (0) - 0,07 Calculate the expected returns and expected standard deviations of a two-stock portfoto having a correlation coefficient of 0.65 under the condition below. Do not und intermediate calculations, Round your answers to four decimal places W-100 Expected return of a two-stock portfolio Expected standard deviation of a two-stock portfolio Wi-0.70 Expected return of a two-stock portfolio Expected standard deviation of a two-stock portfolio cm -0.60 Expected return of a two-stock portfolio Expected standard deviation of a two-stock portfolio dwi - 0.30 Expected return of a two-stock portfolio wer Expected standard deviation of a two-stock portfolio Wi-0.05 Expected return of a two-stock portfolio Expected standard deviation of two-stock portfolio Choose the correct risk-return graphs for weights from parts (a) through (e) when 0.65 0.00065. The correct graph is Selena X HW2 Portfolio and Pricing Theory WWW. Expected return of a two-stock portfolio Expected standard deviation of a two-stock portfolio Choose the correct risk-return graph for weights from parts() through () when -0.650.00 0.65 A-Z The correct graphische ER 0.10 0.17 EEE 0.10 10:15 wer 10:14 0.12 10.12 F011 0.01.2.2_092...004025 0.0....0.97.. Station of -0.65 -0.00 0.60 8 TECH) HW2 Portfolio and Pricing Theory 2.2.4.3......029.99...20 Standard Devation of Return X -0.65 0.00 0.65 B TER 0.10 0.17 0.16 0.15 0.14 F0:13 wer 10.12 0.11 0.919.020.02...094.005_0.09 0.022.09 Standart Deviation of Return 12 -0.65 -0.00 -0.65 b 0.65 '12 -0.00 -0.65 Tools C. TEIRO 0.10 F0:17 EES ips D 0.16 aps D 0.15 U 10.14 1013 G F0:12 es: Lower 0.11 0.01 0.022_0.00_0.24 0.250.00...0.070.pe Standard Devation of Retur -0.65 -0.00 -0.65 D ER) 10.16 -0.65 -0.00 -0.65 and Study Tools iptions D TER) F0.10 Success Tips 0.17 uccess Tips Fo.16 FOR YOU 0.15 S WITH STABILITY BALL 10.14 Um 6 +0.13 Exercises: Lower 10.12 0.11 0.01.2.92.0.03 0.04 0.05 0.00 0.07 0.08 Standard Devation of Return eedback -0.65 -0.00 0.65
