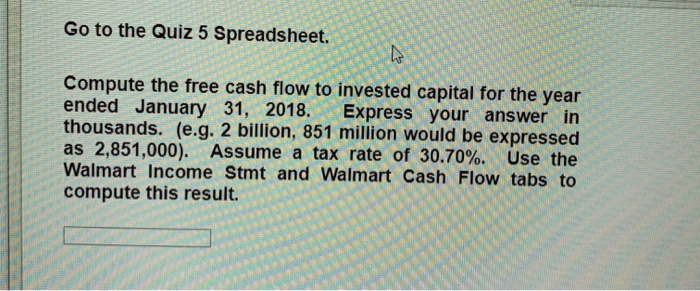
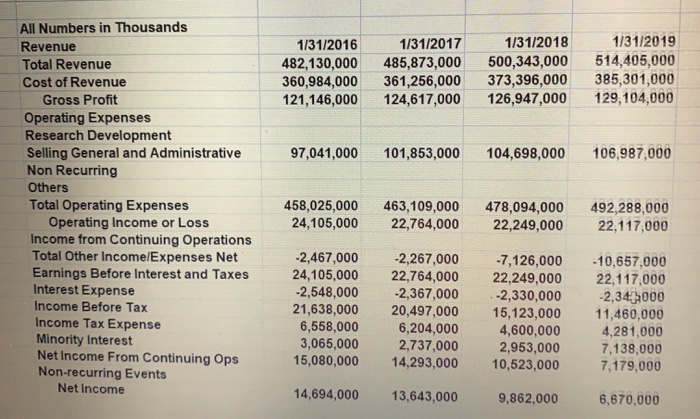
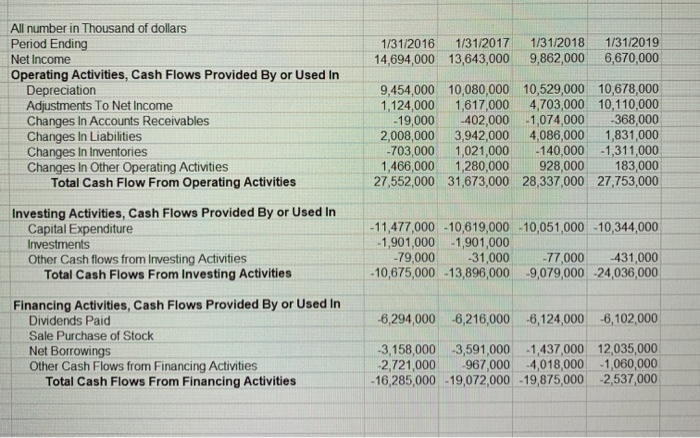
Go to the Quiz 5 Spreadsheet. Compute the free cash flow to invested capital for the year ended January 31, 2018. thousands. (e.g. 2 billion, 851 million would be expressed as 2,851,000). Assume a tax rate of 30.70 % . Use the Walmart Income Stmt and Walmart Cash Flow tabs to Express your answer in compute this result. All Numbers in Thousands 1/31/2019 1/31/2018 1/31/2016 1/31/2017 Revenue 514,405,000 385,301,000 129,104,000 Total Revenue 500,343,000 373,396,000 126,947,000 482,130,000 360,984,000 121,146,000 485,873,000 361,256,000 124,617,000 Cost of Revenue Gross Profit Operating Expenses Research Development Selling General and Administrative Non Recurring 97,041,000 106,987,000 101,853,000 104,698,000 Others Total Operating Expenses Operating Income or Loss Income from Continuing Operations Total Other Income/Expenses Net Earnings Before Interest and Taxes Interest Expense Income Before Tax 458,025,000 24,105,000 463,109,000 22,764,000 478,094,000 22,249,000 492,288,000 22,117,000 -2,467,000 24,105,000 -2,548,000 21,638,000 6,558,000 3,065,000 -2,267,000 22,764,000 -2,367,000 20,497,000 6,204,000 2,737,000 14,293,000 -7,126,000 22,249,000 -2,330,000 15,123,000 10,657,000 22,117,000 -2,34000 11,460,000 Income Tax Expense 4,600,000 4,281,000 7,138,000 Minority Interest Net Income From Continuing Ops Non-recurring Events Net Income 2,953,000 15,080,000 10,523,000 7,179,000 14,694,000 13,643,000 9,862,000 6,670,000 All number in Thousand of dollars 1/31/2019 1/31/2017 1/31/2018 Period Ending Net Income 1/31/2016 9,862,000 6,670,000 14,694,000 13,643,000 Operating Activities, Cash Flows Provided By or Used In Depreciation Adjustments To Net Income Changes In Accounts Receivables Changes In Liabilities Changes In Inventories Changes In Other Operating Activities Total Cash Flow From Operating Activities 9,454,000 10,080,000 10,529,000 10,678,000 1,617,000 4,703,000 10,110,000 368,000 1,831,000 -140,000 1,311,000 928,000 1,124,000 -19,000 2,008,000 -703,000 1,466,000 402,000 -1,074,000 3,942,000 1,021,000 1,280,000 27,552,000 31,673,000 28,337,000 27,753,000 4,086,000 183,000 Investing Activities, Cash Flows Provided By or Used In Capital Expenditure -11,477,000 -10,619,000 -10,051,000-10,344,000 -1,901,000 -1,901,000 -79,000 -10,675,000 -13,896,000 9,079,000 24,036,000 Investments -31,000 -77,000 431.000 Other Cash flows from Investing Activities Total Cash Flows From Investing Activities Financing Activities, Cash Flows Provided By or Used In Dividends Paid -6,294,000 6216,000 6,124,000 6,102,000 Sale Purchase of Stock 3,158,000 3,591,000 -1,437,000 12,035,000 2,721,000 -16,285,000 -19,072,000 -19,875,000 2,537,000 Net Borrowings Other Cash Flows from Financing Activities Total Cash Flows From Financing Activities 967,000 4,018,000 -1,060,000


