Question
GOAL 2: FOLLOW THE INSTRUCTIONS BELOW 1. When completing the ratios, please label your ratio and type out the description first. For example, Current Ratio
GOAL 2: FOLLOW THE INSTRUCTIONS BELOW
1. When completing the ratios, please label your ratio and type out the description first. For example, Current Ratio = Current Assets / Current Liabilities. Next, show the amounts used in your computation. For example, 100,000 / 50,000 (this way if just the numerator is wrong, you will not lose ALL the points) Finally, always express your answer appropriately. For example, 2.00 to 1. (using the nearest hundredth or hundredth of a percent) Remember, you are only computing the most recent year (not both years) for each company.
2. The analysis is half of the points. Typically there is not just one ratio you will use in your analysis, but rather there will be a combination of ratios to draw on and support your reasoning. Also, write as though the reader is not looking at the ratios, for example "XYZ Company has an average days to sell inventory of xxx and ABC Company is xxx days. When comparing this along with the XXX ratio and the XX etc". Even if the ratios show better in one area than another, state that, and be clear in your analysis. Re-read your analysis to make sure it makes sense and is specific and clear.
Remember there is information in your textbook to explain the meaning of each ratio and guide you with the articulation of your analysis ! Use your resources wisely !

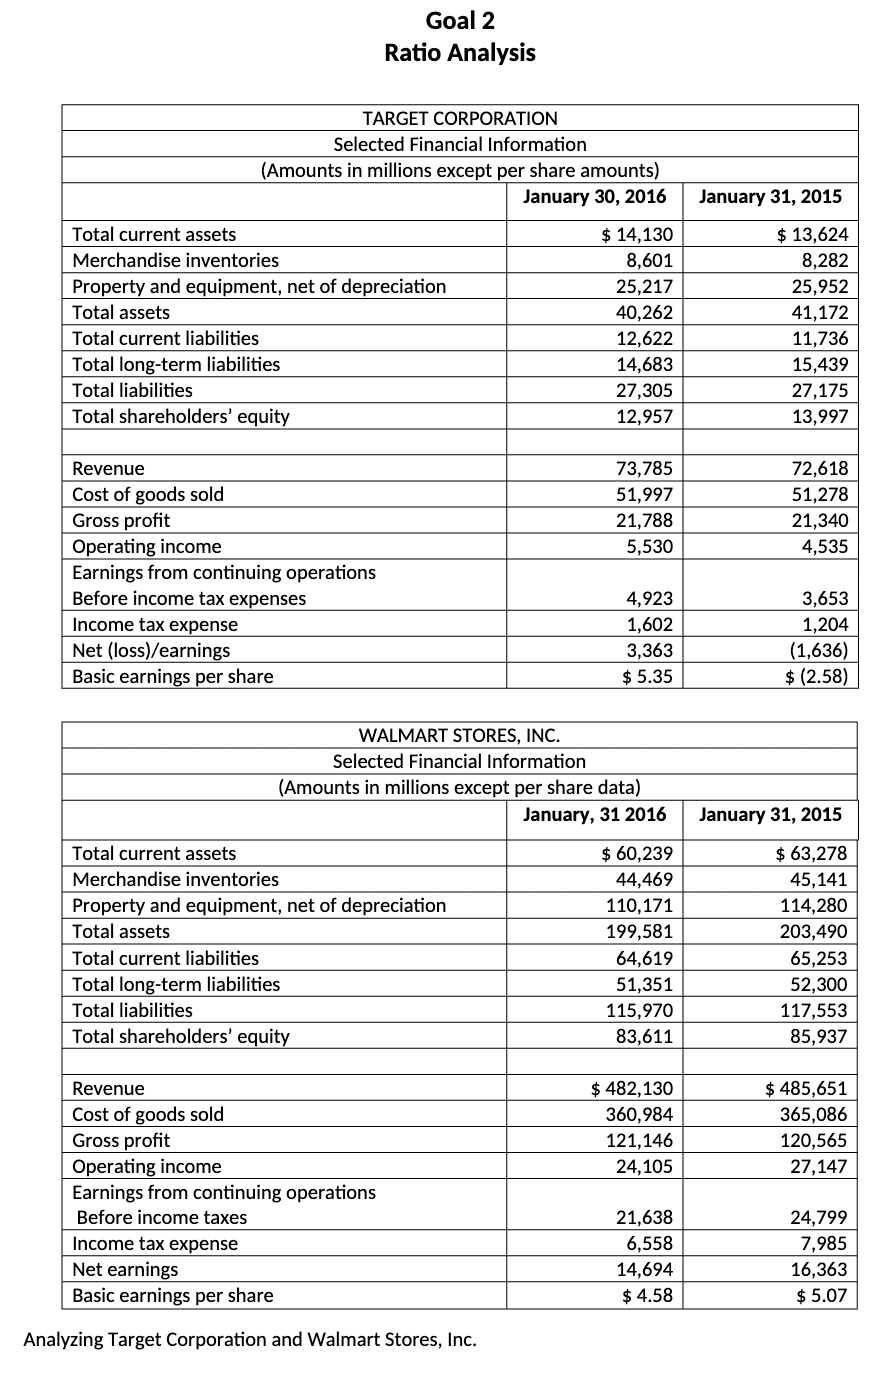
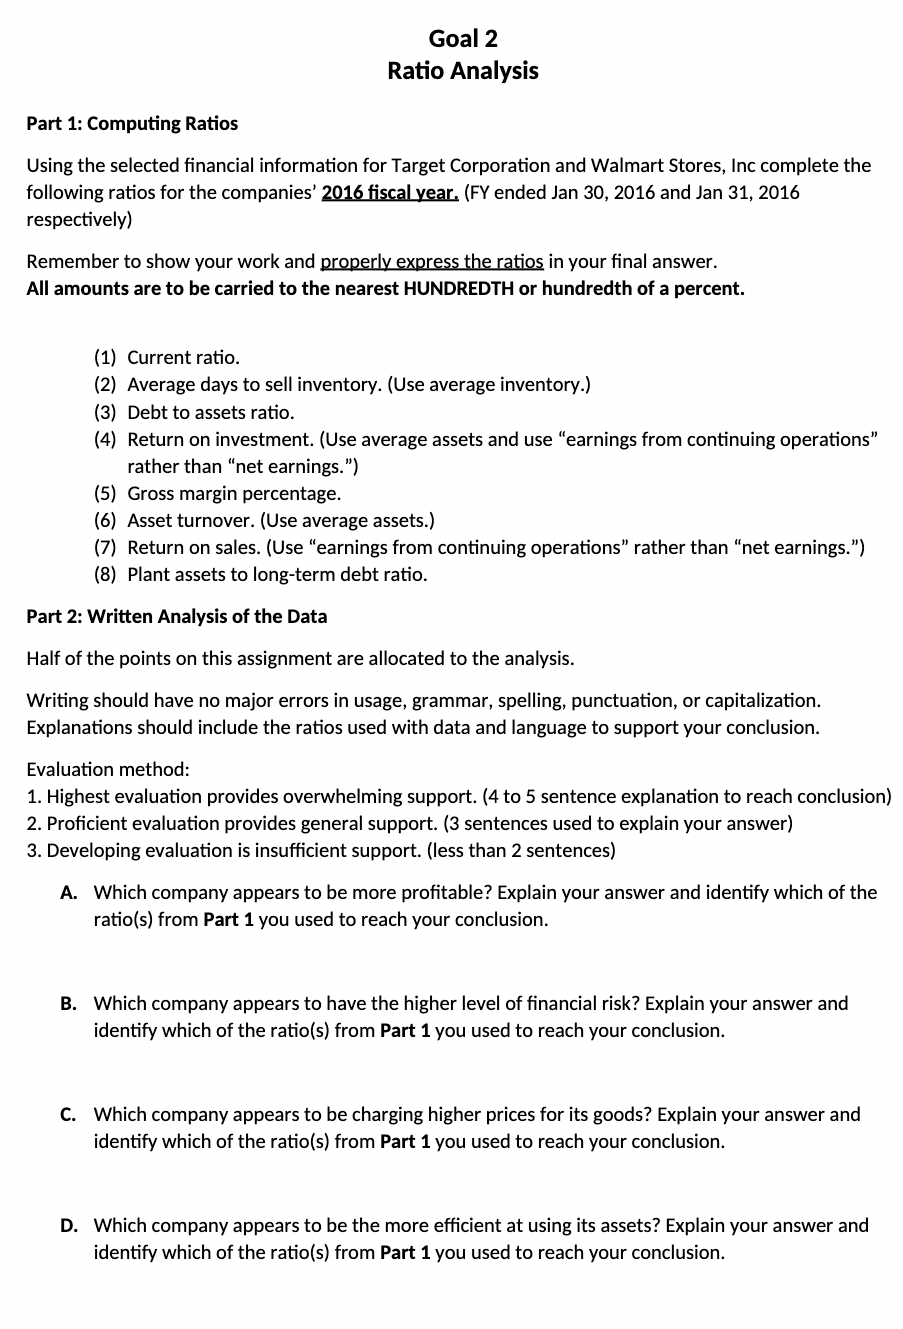
 Goal 2 Ratio Analysis Analyzing Target Corporation and Walmart Stores, Inc. Goal 2 Ratio Analysis Part 1: Computing Ratios Using the selected financial information for Target Corporation and Walmart Stores, Inc complete the following ratios for the companies' 2016 fiscal year. (FY ended Jan 30, 2016 and Jan 31, 2016 respectively) Remember to show your work and properly express the ratios in your final answer. All amounts are to be carried to the nearest HUNDREDTH or hundredth of a percent. (1) Current ratio. (2) Average days to sell inventory. (Use average inventory.) (3) Debt to assets ratio. (4) Return on investment. (Use average assets and use "earnings from continuing operations" rather than "net earnings.") (5) Gross margin percentage. (6) Asset turnover. (Use average assets.) (7) Return on sales. (Use "earnings from continuing operations" rather than "net earnings.") (8) Plant assets to long-term debt ratio. Part 2: Written Analysis of the Data Half of the points on this assignment are allocated to the analysis. Writing should have no major errors in usage, grammar, spelling, punctuation, or capitalization. Explanations should include the ratios used with data and language to support your conclusion. Evaluation method: 1. Highest evaluation provides overwhelming support. (4 to 5 sentence explanation to reach conclusion) 2. Proficient evaluation provides general support. (3 sentences used to explain your answer) 3. Developing evaluation is insufficient support. (less than 2 sentences) A. Which company appears to be more profitable? Explain your answer and identify which of the ratio(s) from Part 1 you used to reach your conclusion. B. Which company appears to have the higher level of financial risk? Explain your answer and identify which of the ratio(s) from Part 1 you used to reach your conclusion. C. Which company appears to be charging higher prices for its goods? Explain your answer and identify which of the ratio(s) from Part 1 you used to reach your conclusion. D. Which company appears to be the more efficient at using its assets? Explain your answer and identify which of the ratio(s) from Part 1 you used to reach your conclusion
 Step by Step Solution
There are 3 Steps involved in it
Step: 1

Get Instant Access to Expert-Tailored Solutions
See step-by-step solutions with expert insights and AI powered tools for academic success
Step: 2

Step: 3

Ace Your Homework with AI
Get the answers you need in no time with our AI-driven, step-by-step assistance
Get Started


