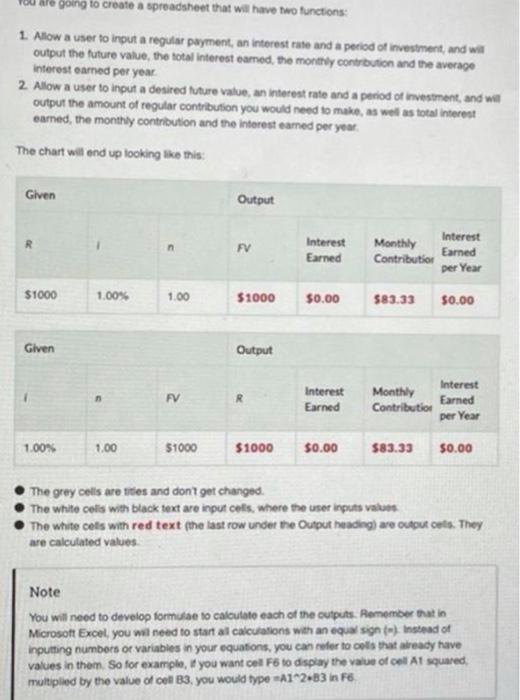
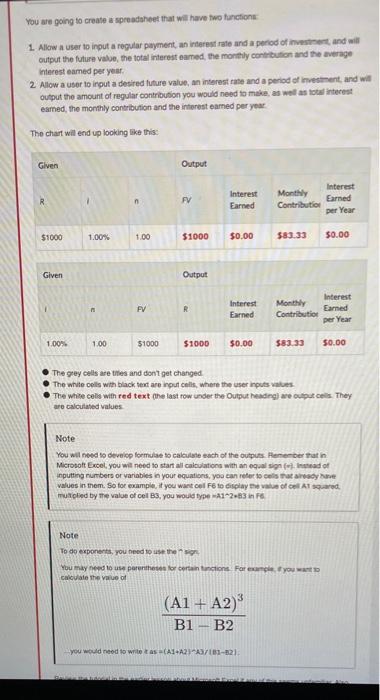
going to create a spreadsheet that will have two functions: 1. Allow a user to input a regular payment, an interest rate and a period of investment, and will output the future value, the total interest eamed, the monthly contribution and the average interest earned per year 2. Allow a user to input a desired future value, an interest rate and a period of investment, and we output the amount of regular contribution you would need to make, as well as total interest earned, the monthly contribution and the interest eamed per you The chart will end up looking like this: Given Output R n FV Interest Earned interest Monthly Earned Contributio per Year $1000 1.00% 1.00 $1000 50.00 583.33 50.00 Given Output FV Interest Earned Interest Monthly Contributio Earned per Year 1.00% 1.00 $1000 $1000 $0.00 583.33 50.00 The grey cells are uitles and don't get changed The white colls with black text are input cels, where the user inputs values The white cels with red text (the last row under the Output heading) are output cols. They are calculated values Note You will need to develop formulae to calculato each of the outputs. Remember that in Microsoft Excel, you will need to start al calculations with an equal sign. Instead of inputting numbers of variables in your equations, you can refer tools that already have values in them. So for example, you want cel F6 to display the value of col At squared multiplied by the value of cel B3, you would type A1^2.83 in F6 You are going to create a spreadsheet that will have two function 1. Allow a user to input a regular payment, an interest rate and a period of investment and will output the future value the total interesteamed, the monthly contribution and the average Interesteamed per year. 2 Allow a user to input a desired future value, an interest rate and a period of investment and will output the amount of regular contribution you would need to make as well as to terest eamed the monthly contribution and the interest eamed per year The chart will end up looking like this Given Output R Interest Earned Interest Earned FV Monthly Contributio per Year $1000 1.00% 1.00 $1000 $0.00 $83.33 $0.00 Given Output FV Interest Earned Interest Earned R Monthly Contributor per Year 1.00% 1.00 $1000 $1000 $0.00 $83.33 $0.00 The grey cells are tres and don't get changed The white colls with black tent are not cells, where the user inputsvatus The white cols with red text (the last row under the Output heading are output cols They are calculated values Note You will need to develop formule to calculate each of the outputs Remember that in Microsoft Excel, you will need to start all calculations with an equal in nad of inputting numbers or variables in your equations, you can refer to trave values in them. So for example, if you want ool F6 to display the value of cell AT Suared mulled by the value of cel Bs, you would type 212.83 in F Note To do exponents, you need to use the You may need to parentes for certain actions. For exam you want calculate the value of (A1 + A2) B1 - B2 you would need to write tas(A1A2A/161-621 going to create a spreadsheet that will have two functions: 1. Allow a user to input a regular payment, an interest rate and a period of investment, and will output the future value, the total interest eamed, the monthly contribution and the average interest earned per year 2. Allow a user to input a desired future value, an interest rate and a period of investment, and we output the amount of regular contribution you would need to make, as well as total interest earned, the monthly contribution and the interest eamed per you The chart will end up looking like this: Given Output R n FV Interest Earned interest Monthly Earned Contributio per Year $1000 1.00% 1.00 $1000 50.00 583.33 50.00 Given Output FV Interest Earned Interest Monthly Contributio Earned per Year 1.00% 1.00 $1000 $1000 $0.00 583.33 50.00 The grey cells are uitles and don't get changed The white colls with black text are input cels, where the user inputs values The white cels with red text (the last row under the Output heading) are output cols. They are calculated values Note You will need to develop formulae to calculato each of the outputs. Remember that in Microsoft Excel, you will need to start al calculations with an equal sign. Instead of inputting numbers of variables in your equations, you can refer tools that already have values in them. So for example, you want cel F6 to display the value of col At squared multiplied by the value of cel B3, you would type A1^2.83 in F6 You are going to create a spreadsheet that will have two function 1. Allow a user to input a regular payment, an interest rate and a period of investment and will output the future value the total interesteamed, the monthly contribution and the average Interesteamed per year. 2 Allow a user to input a desired future value, an interest rate and a period of investment and will output the amount of regular contribution you would need to make as well as to terest eamed the monthly contribution and the interest eamed per year The chart will end up looking like this Given Output R Interest Earned Interest Earned FV Monthly Contributio per Year $1000 1.00% 1.00 $1000 $0.00 $83.33 $0.00 Given Output FV Interest Earned Interest Earned R Monthly Contributor per Year 1.00% 1.00 $1000 $1000 $0.00 $83.33 $0.00 The grey cells are tres and don't get changed The white colls with black tent are not cells, where the user inputsvatus The white cols with red text (the last row under the Output heading are output cols They are calculated values Note You will need to develop formule to calculate each of the outputs Remember that in Microsoft Excel, you will need to start all calculations with an equal in nad of inputting numbers or variables in your equations, you can refer to trave values in them. So for example, if you want ool F6 to display the value of cell AT Suared mulled by the value of cel Bs, you would type 212.83 in F Note To do exponents, you need to use the You may need to parentes for certain actions. For exam you want calculate the value of (A1 + A2) B1 - B2 you would need to write tas(A1A2A/161-621