Good day tutor, I need assistance with the following questions below. Thank you All information for the question is attached, do not appendix table is
Good day tutor, I need assistance with the following questions below. Thank you
All information for the question is attached, do not appendix table is just a reference for T-Values, Degrees of freedom, and other statistical analysis references.
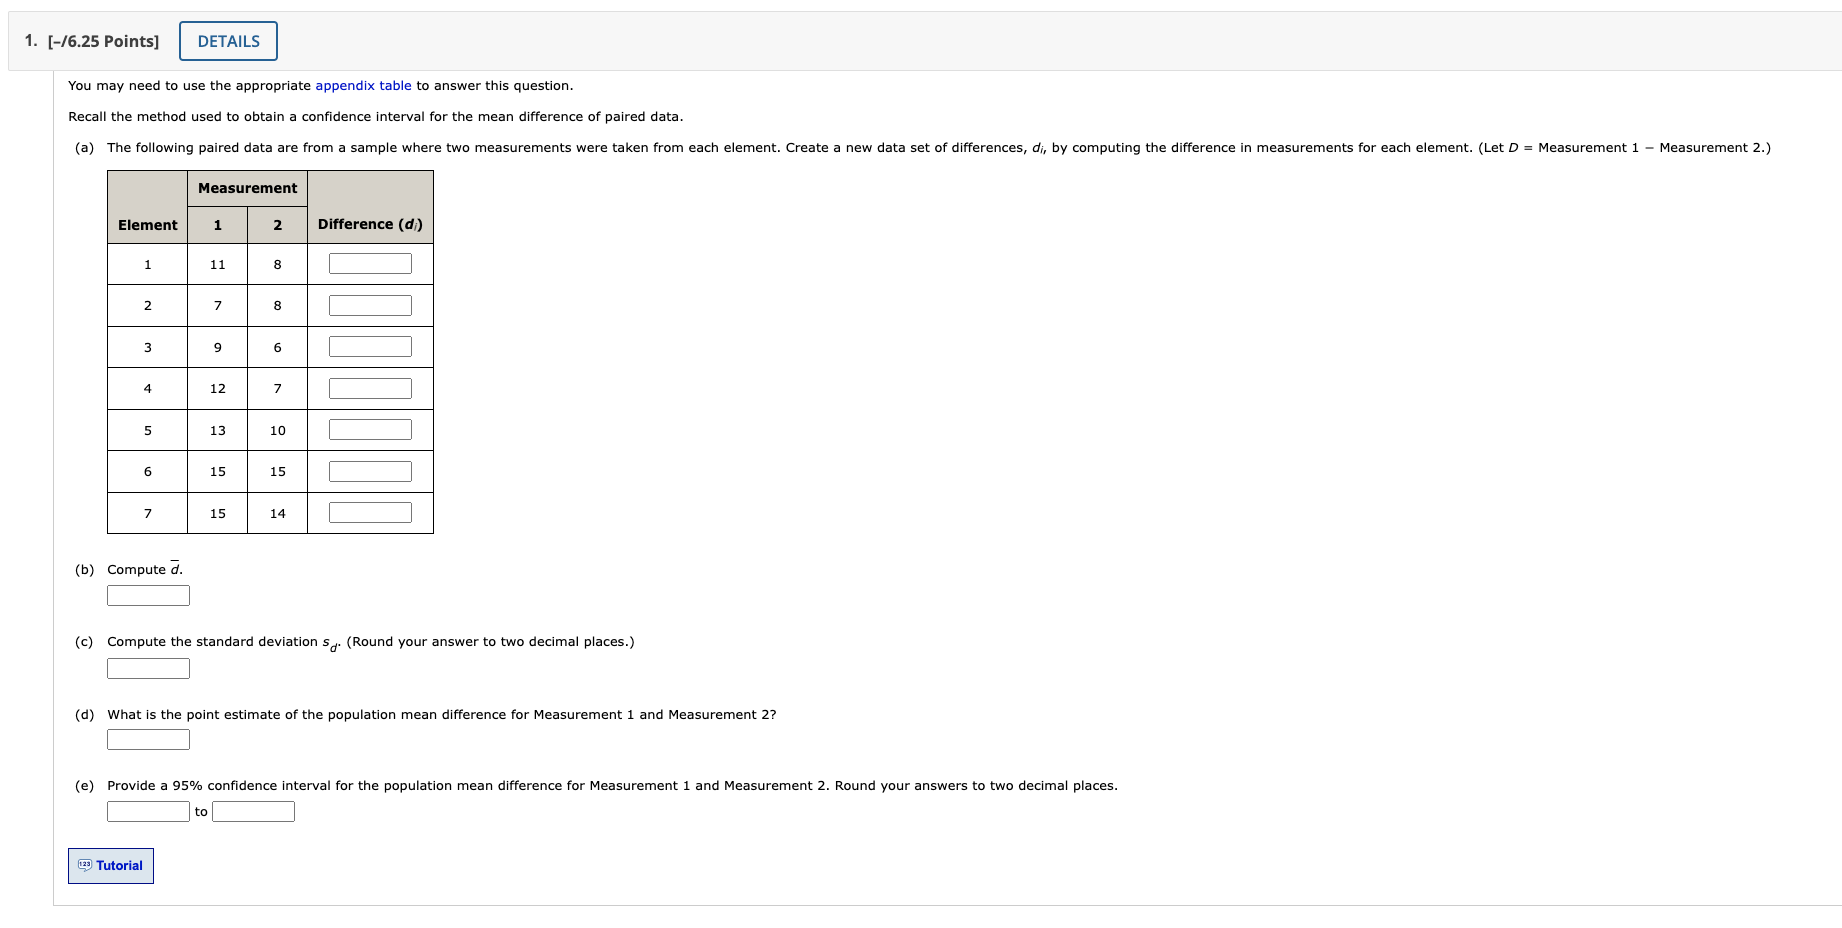
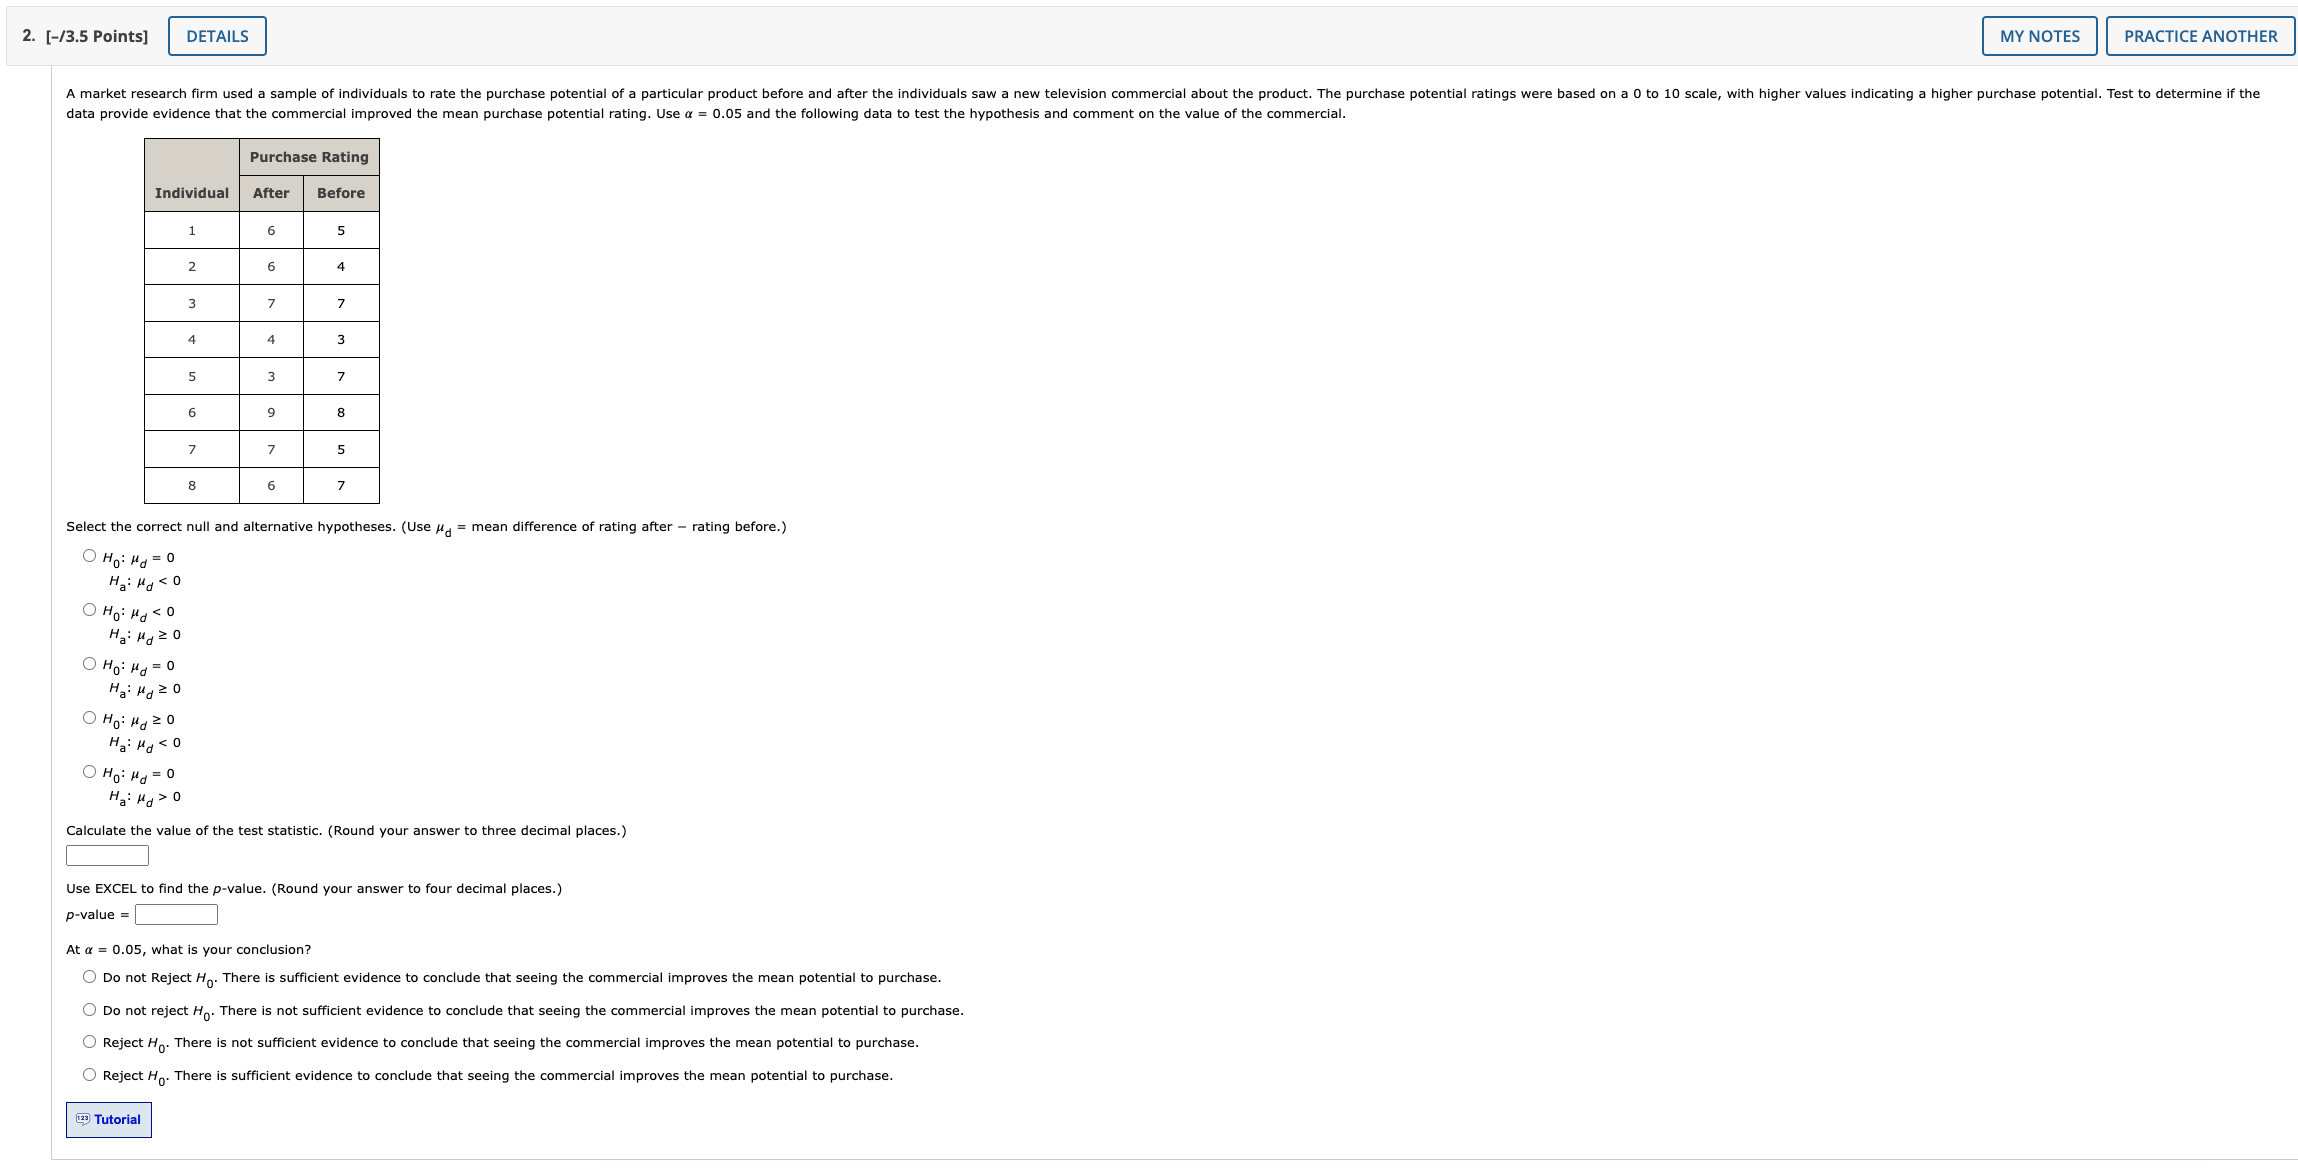
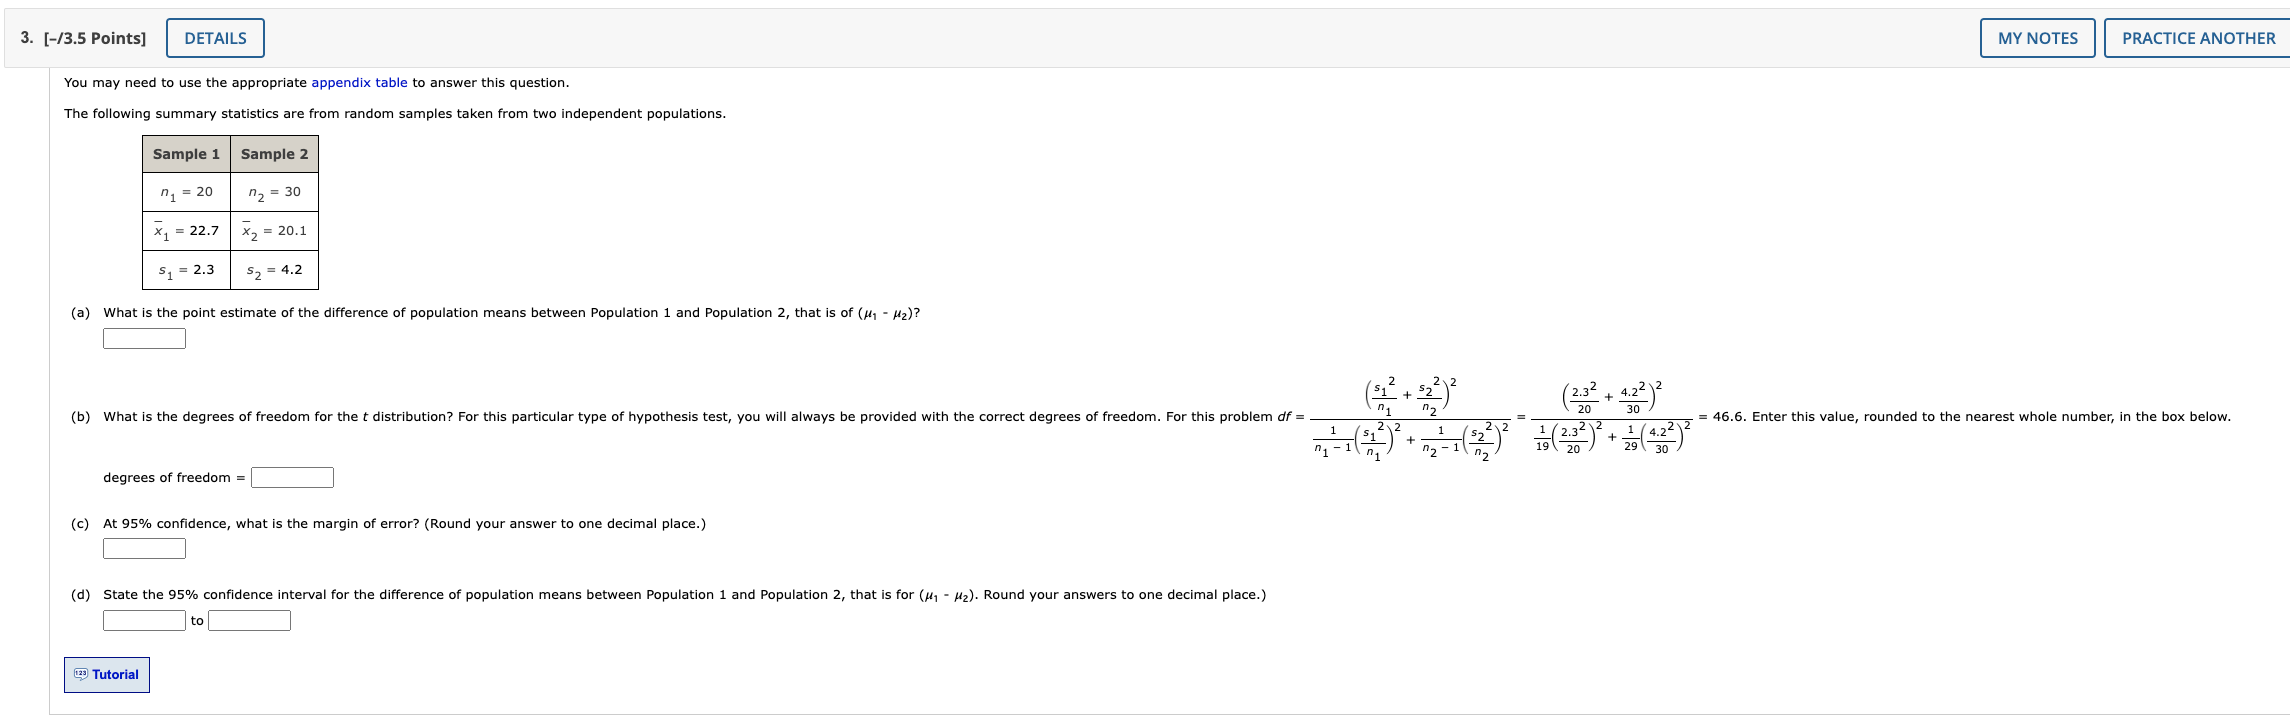
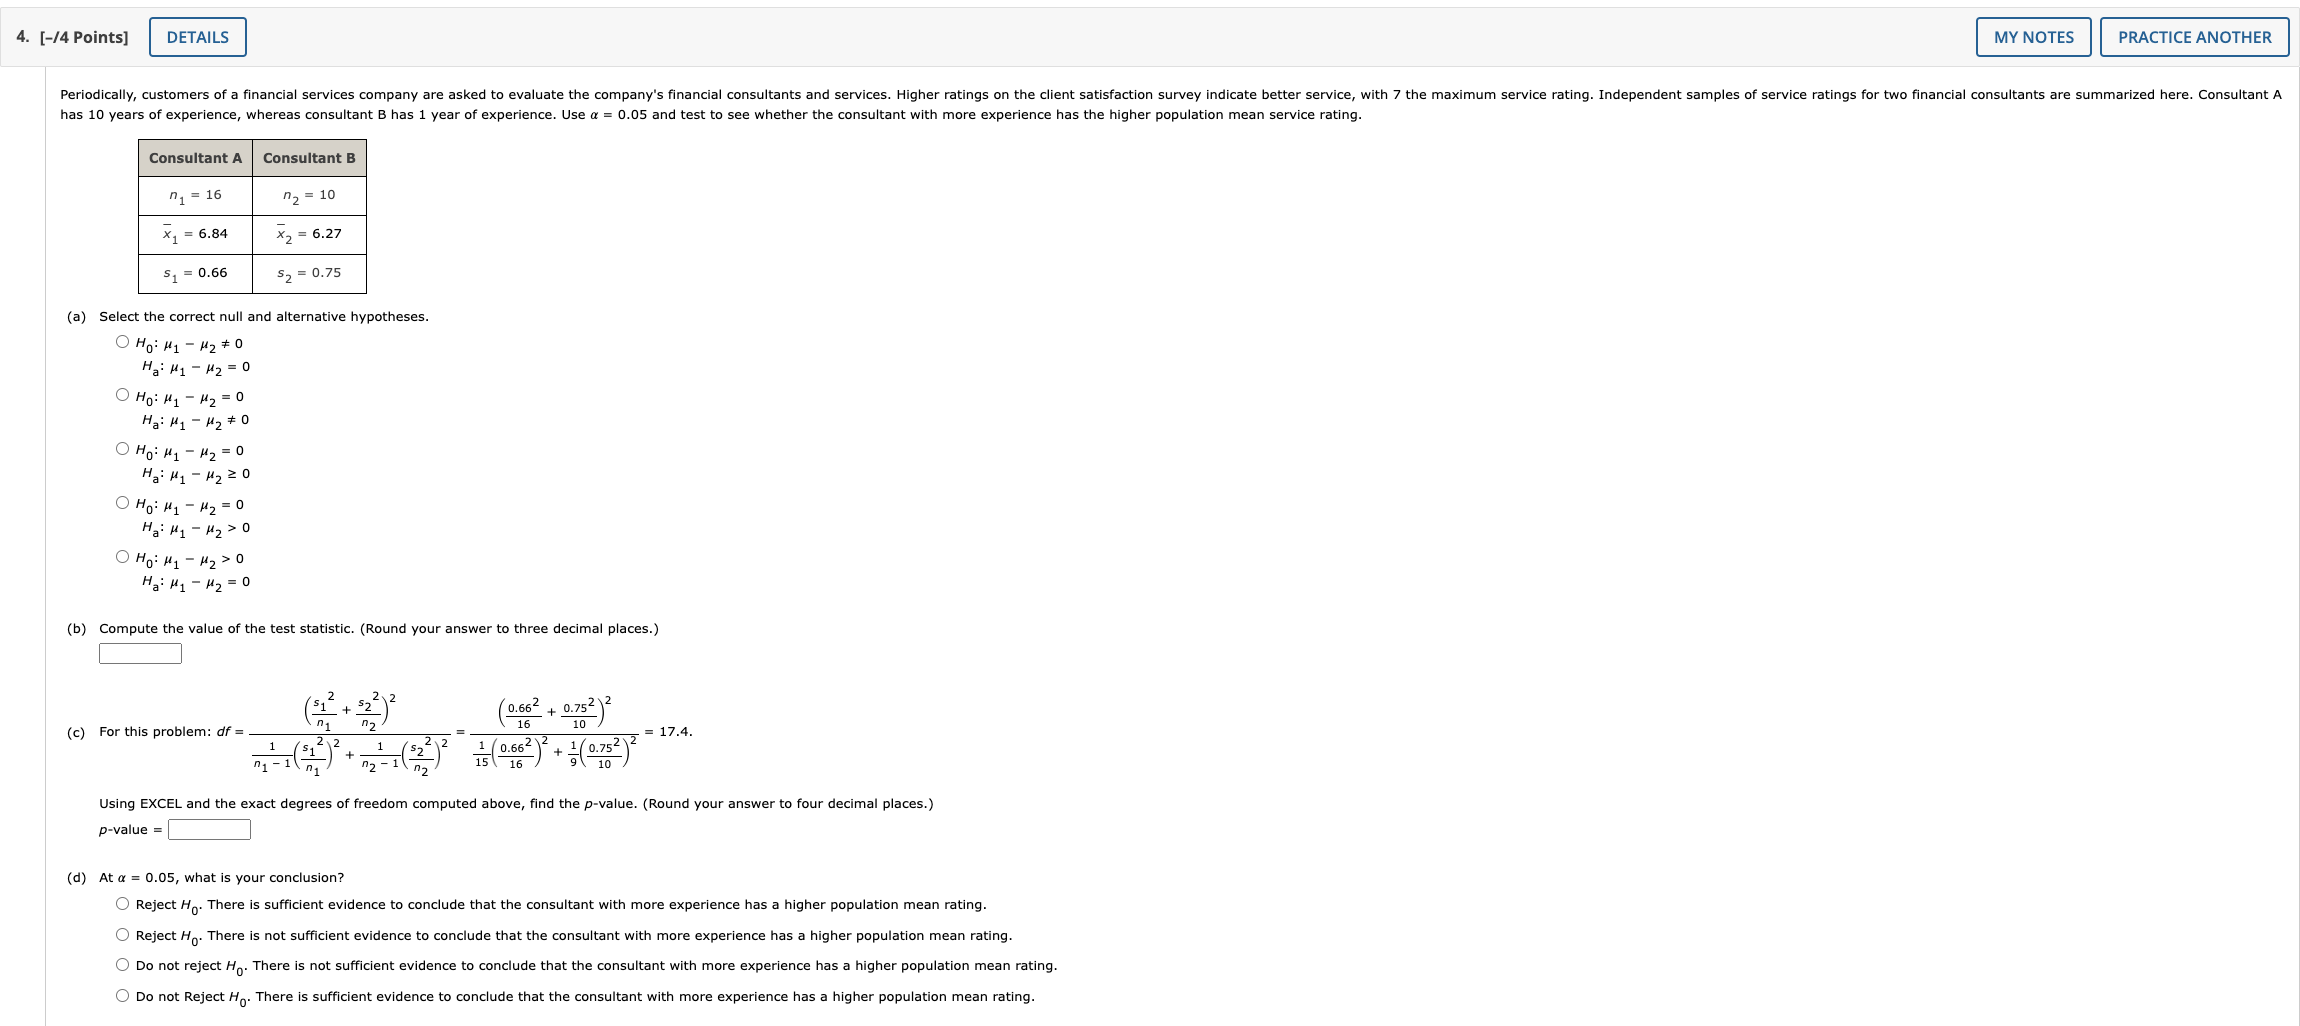
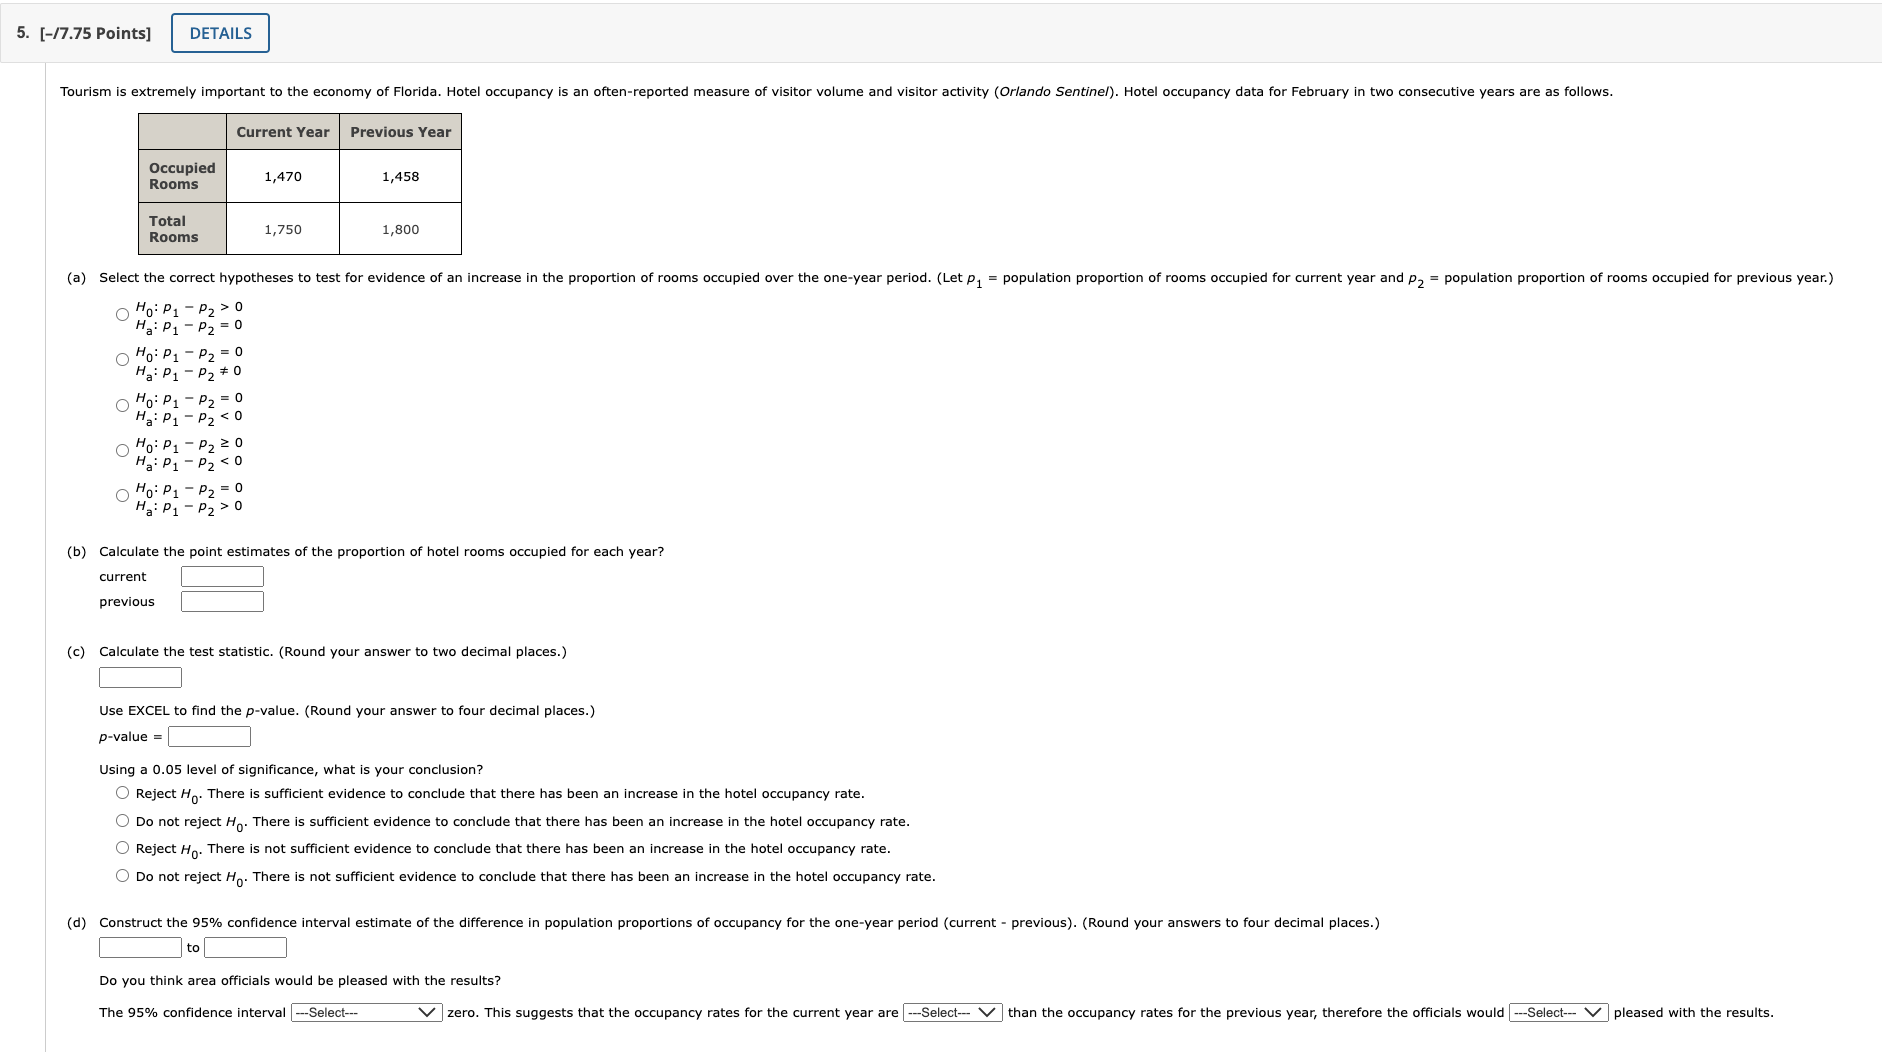
1. [-/6.25 Points] DETAILS You may need to use the appropriate appendix table to answer this question. Recall the method used to obtain a confidence interval for the mean difference of paired data. (a) The following paired data are from a sample where two measurements were taken from each element. Create a new data set of differences, di, by computing the difference in measurements for each element. (Let D = Measurement 1 - Measurement 2.) Measurement Element 2 Difference (di) 1 11 2 7 3 6 4 12 7 5 13 10 6 15 15 7 15 14 (b) Compute d. (c) Compute the standard deviation s. (Round your answer to two decimal places.) (d) What is the point estimate of the population mean difference for Measurement 1 and Measurement 2? (e) Provide a 95% confidence interval for the population mean difference for Measurement 1 and Measurement 2. Round your answers to two decimal places. 12 Tutorial2. [-/3.5 Points] DETAILS MY NOTES PRACTICE ANOTHER A market research firm used a sample of individuals to rate the purchase potential of a particular product before and after the individuals saw a new television commercial about the product. The purchase potential ratings were based on a 0 to 10 scale, with higher values indicating a higher purchase potential. Test to determine if the data provide evidence that the commercial improved the mean purchase potential rating. Use a = 0.05 and the following data to test the hypothesis and comment on the value of the commercial. Purchase Rating Individual After Before 1 6 5 2 6 4 3 7 4 4 3 5 3 7 6 9 8 5 8 Select the correct null and alternative hypotheses. (Use / = mean difference of rating after - rating before.) O Ho: Hd = 0 Ha : Hg o Calculate the value of the test statistic. (Round your answer to three decimal places.) Use EXCEL to find the p-value. (Round your answer to four decimal places.) p-value = At a = 0.05, what is your conclusion? Do not Reject Ho. There is sufficient evidence to conclude that seeing the commercial improves the mean potential to purchase. O Do not reject Ho. There is not sufficient evidence to conclude that seeing the commercial improves the mean potential to purchase. O Reject Ho. There is not sufficient evidence to conclude that seeing the commercial improves the mean potential to purchase. O Reject Ho. There is sufficient evidence to conclude that seeing the commercial improves the mean potential to purchase. 123 Tutorial3. [-/3.5 Points] DETAILS MY NOTES PRACTICE ANOTHER You may need to use the appropriate appendix table to answer this question. The following summary statistics are from random samples taken from two independent populations. Sample 1 Sample 2 n, = 20 72 = 30 X1 = 22.7 *2 = 20.1 $1 = 2.3 $2 = 4.2 (a) What is the point estimate of the difference of population means between Population 1 and Population 2, that is of (1 - /2)? $1 + 52 2.3 + 4.22 2 m1 20 30 (b) What is the degrees of freedom for the t distribution? For this particular type of hypothesis test, you will always be provided with the correct degrees of freedom. For this problem of 46.6. Enter this value, rounded to the nearest whole number, in the box below. 1 ( $ 1 1 (2.32 2 1 4.22 2 + n, - 1 \\ n2 19 20 + = 29 30 degrees of freedom = (c) At 95% confidence, what is the margin of error? (Round your answer to one decimal place.) (d) State the 95% confidence interval for the difference of population means between Population 1 and Population 2, that is for (#1 - /2). Round your answers to one decimal place.) to 123 Tutorial4. [-/4 Points] DETAILS MY NOTES PRACTICE ANOTHER Periodically, customers of a financial services company are asked to evaluate the company's financial consultants and services. Higher ratings on the client satisfaction survey indicate better service, with 7 the maximum service rating. Independent samples of service ratings for two financial consultants are summarized here. Consultant A has 10 years of experience, whereas consultant B has 1 year of experience. Use a = 0.05 and test to see whether the consultant with more experience has the higher population mean service rating. Consultant A Consultant B n1 = 16 2 = 10 X1 = 6.84 *2 = 6.27 51 = 0.66 $2 = 0.75 (a) Select the correct null and alternative hypotheses. O HO: H1 - H2 Ha: H1 - H2 = 0 O Ho: H1 - H2 = 0 Ha: H 1 - H2 # 0 OHO: H1 - H2 = 0 Ha: H 1 - H2 20 OHO: H1 - H2 = 0 Ha: M1 - H2> o OHO: H 1 - H2>o Ha: M1 - H2 = 0 (b) Compute the value of the test statistic. (Round your answer to three decimal places.) ($1 0.662 + 0.752 2 (c) For this problem: df = _ 10 = 17.4. 21 - 1 ( 2 ) + 72 - ( $2 ) 2 1 0.662) 16 "+ 1 0.752) 10 Using EXCEL and the exact degrees of freedom computed above, find the p-value. (Round your answer to four decimal places.) p-value = (d) At a = 0.05, what is your conclusion? O Reject Ho. There is sufficient evidence to conclude that the consultant with more experience has a higher population mean rating. O Reject Ho. There is not sufficient evidence to conclude that the consultant with more experience has a higher population mean rating. O Do not reject Ho. There is not sufficient evidence to conclude that the consultant with more experience has a higher population mean rating. O Do not Reject Ho. There is sufficient evidence to conclude that the consultant with more experience has a higher population mean rating.5. [-/7.75 Points] DETAILS Tourism is extremely important to the economy of Florida. Hotel occupancy is an often-reported measure of visitor volume and visitor activity (Orlando Sentinel). Hotel occupancy data for February in two consecutive years are as follows. Current Year Previous Year Occupied 1,470 1,458 Rooms Total Rooms 1,750 1,800 (a) Select the correct hypotheses to test for evidence of an increase in the proportion of rooms occupied over the one-year period. (Let p, = population proportion of rooms occupied for current year and P2 = population proportion of rooms occupied for previous year.) Ho: P1 - P2 > 0 H.: P1 - P2 = 0 Ho: P1 - P2 = 0 OH: P1 - P2 + 0 Ho: P1 H.: P1 - P2 o (b) Calculate the point estimates of the proportion of hotel rooms occupied for each year? current previous (c) Calculate the test statistic. (Round your answer to two decimal places.) Use EXCEL to find the p-value. (Round your answer to four decimal places.) p-value = Using a 0.05 level of significance, what is your conclusion? O Reject Ho. There is sufficient evidence to conclude that there has been an increase in the hotel occupancy rate. O Do not reject Ho. There is sufficient evidence to conclude that there has been an increase in the hotel occupancy rate. O Reject Ho. There is not sufficient evidence to conclude that there has been an increase in the hotel occupancy rate. O Do not reject Ho. There is not sufficient evidence to conclude that there has been an increase in the hotel occupancy rate. (d) Construct the 95% confidence interval estimate of the difference in population proportions of occupancy for the one-year period (current - previous). (Round your answers to four decimal places.) to Do you think area officials would be pleased with the results? The 95% confidence interval --Select--- Vzero. This suggests that the occupancy rates for the current year are --Select-- V than the occupancy rates for the previous year, therefore the officials would ---Select-- V pleased with the results
Step by Step Solution
There are 3 Steps involved in it
Step: 1
Get Instant Access to Expert-Tailored Solutions
See step-by-step solutions with expert insights and AI powered tools for academic success
Step: 2
Step: 3
Ace Your Homework with AI
Get the answers you need in no time with our AI-driven, step-by-step assistance