Good evening! I am in MBA615 working on Unit 5's homework, Question#7 and I'm stuck. I've attached the spreadsheet and question. Please provide me with
Good evening! I am in MBA615 working on Unit 5's homework, Question#7 and I'm stuck. I've attached the spreadsheet and question. Please provide me with the ANSWERS and step-by-step instructions as much as possible, PLEASE. THAAANK YOU SO MUCH FOR YOUR HELP IN ADVANCE! I APPRECIATE IT!
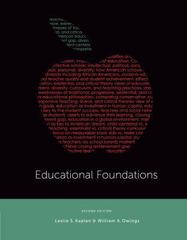
MBA615_Unit 5 HOMEWORK.xIsx - Saved Search Esther Colvin EC X File Home Insert Draw Page Layout Formulas Data Review View Help ProjectWise Acrobat Share Comments OC is i Get Add-ins h? e or Q PivotTable Recommended Table Illustrations Recommended Slicer Timeline Text Symbols My Add-ins Maps PivotChart 3D Line Column Win/ Link Comment PivotTables Charts Map v Loss Tables Add-ins Charts Tours Sparklines Filters Links Comments AutoSave . Off) D5 X V fx A B D E F G H M N O P Q R S Using the data in the table: a. What was the average annual return of Microsoft stock from 2005-2017? b. What was the annual volatility for Microsoft stock from 2005-2017? (Click on the following icon in order to copy its contents into a spreadsheet.) IAWN Realized Return for the S&P 500, Microsoft, and Treasury Bills, 2005-2017 S&P 500 Microsoft S&P 500 Dividends Realized Realized 1-Month Year End Index Paid* Return Return T-Bill Return 2004 1211.92 200 1248.29 23.15 4.90% - 0.90% 3.00% 2006 1418.3 27.16 15.80% 15.80% 4.80% 2007 1468.36 27.86 5.50% 20.80% 4.70% 10 2008 903.25 21.85 - 37.00% - 44.40% 1.50% 2009 115.1 27.19 26.50% 60.50% 0.10% 11 2010 1257.64 25.44 15.10% - 6.50% 0.10% 12 2011 1257.61 26.59 2.10% - 4.50% 0.00% 13 2012 1426.19 32.67 16.00% 5.80% 0.10% 14 2013 1848.36 39.75 32.40% 44.30% 0.00% 15 2014 2058.9 42.47 13.70% 27.60% 0.00% 2015 2043.94 43.45 1.40% 22.70% 0.00% 16 2016 2238.83 49.56 12.009% 15.10% 0.20% 17 2017 2673.61 53.99 21.80% 40.70% 0.80% 18 "Total dividends paid by the 500 stocks in the portfolio, based on the number of shares of each stock in the index, adjusted until the end of the year, assuming they were reinvested 19 when paid 20 Source: Standard & Poor's, Microsoft and U.S. Treasury Data 21 22 MBA615_Unit 5, Q3 MBA615_Unit5, Q4 MBA615_Unit5, Q5 MBA615_Unit5, Q6 MBA615_Unit5, Q7 + - - + 85% ReadyDo Homework - Unit 5 Homework - Google Chrome 0 X mathxl.com/Student/PlayerHomework.aspx?homeworkld=616008237&questionld=6&flushed=false&cld=6794448¢erwin=yes MBA615DLS1P2022 Managerial Finance Esther Marie Colvin 01/19/22 2:35 PM ? Question 7, P10-9 HW Score: 50%, 10 E Homework: Unit 5 Homework (similar to) of 20 points Part 1 of 2 O Points: 0 of 2 Save Using the data in the table , a. What was the average annual return of Microsoft stock from 2005-2017? b. What was the annual volatility for Microsoft stock from 2005-2017? a. What was the average annual return of Microsoft stock from 2005-2017? The average annual return is %. (Round to two decimal places.) Get more help - Clear all Check answer1/19/22, 2:08 PM Data Table (Click on the following icon in order to copy its contents into a spreadsheet.) Realized Return for the S&P 500, Microsoft, and Treasury Bills, 2005-2017 S&P 500 Microsoft 6&P 500 Dividends Realized Realized 1-Month Year End Index Paid* Return Return T-Bill Return 2004 1211.92 2005 1248.29 23. 15 4.90% - 0.90% 3.00% 2006 1418.3 27.16 15.80% 15.80% 4.80% 2007 1468.36 27.86 5.50% 20.80% 4.70% 2008 903.25 21.85 - 37.00% - 44.40% 1.50% 2009 1115.1 27.19 26.50% 60.50% 0. 10% 2010 1257.64 25.44 15. 10% - 6.50% 0. 10% 2011 1257.61 26.59 2. 10% - 4.50% 0.00% 2012 1426.19 32.67 16.00% 5.80% 0. 10% 2013 1848.36 39.75 32.40% 44.30% 0.00% 2014 2058.9 12.47 13.70% 27.60% 0.00% 2015 2043.94 43.45 1.40% 22.70% 0.00% 2016 2238.83 49.56 12.00% 15.10% 0.20% 2017 2673.61 53.99 21.80% 40.70% .80% *Total dividends paid by the 500 stocks in the portfolio, based on the number of shares of each stock in the index, adjusted until the end of the year, assuming they were reinvested when paid. Source: Standard & Poor's, Microsoft and U.S. Treasury Data https://openvellum.ecollege.com/course.html? courseld=17132327&OpenVellumHMAC=daddd9bed3e140ba3f5c020bc8108055#10010 1/1
Step by Step Solution
There are 3 Steps involved in it
Step: 1
Get Instant Access to Expert-Tailored Solutions
See step-by-step solutions with expert insights and AI powered tools for academic success
Step: 2
Step: 3
Ace Your Homework with AI
Get the answers you need in no time with our AI-driven, step-by-step assistance