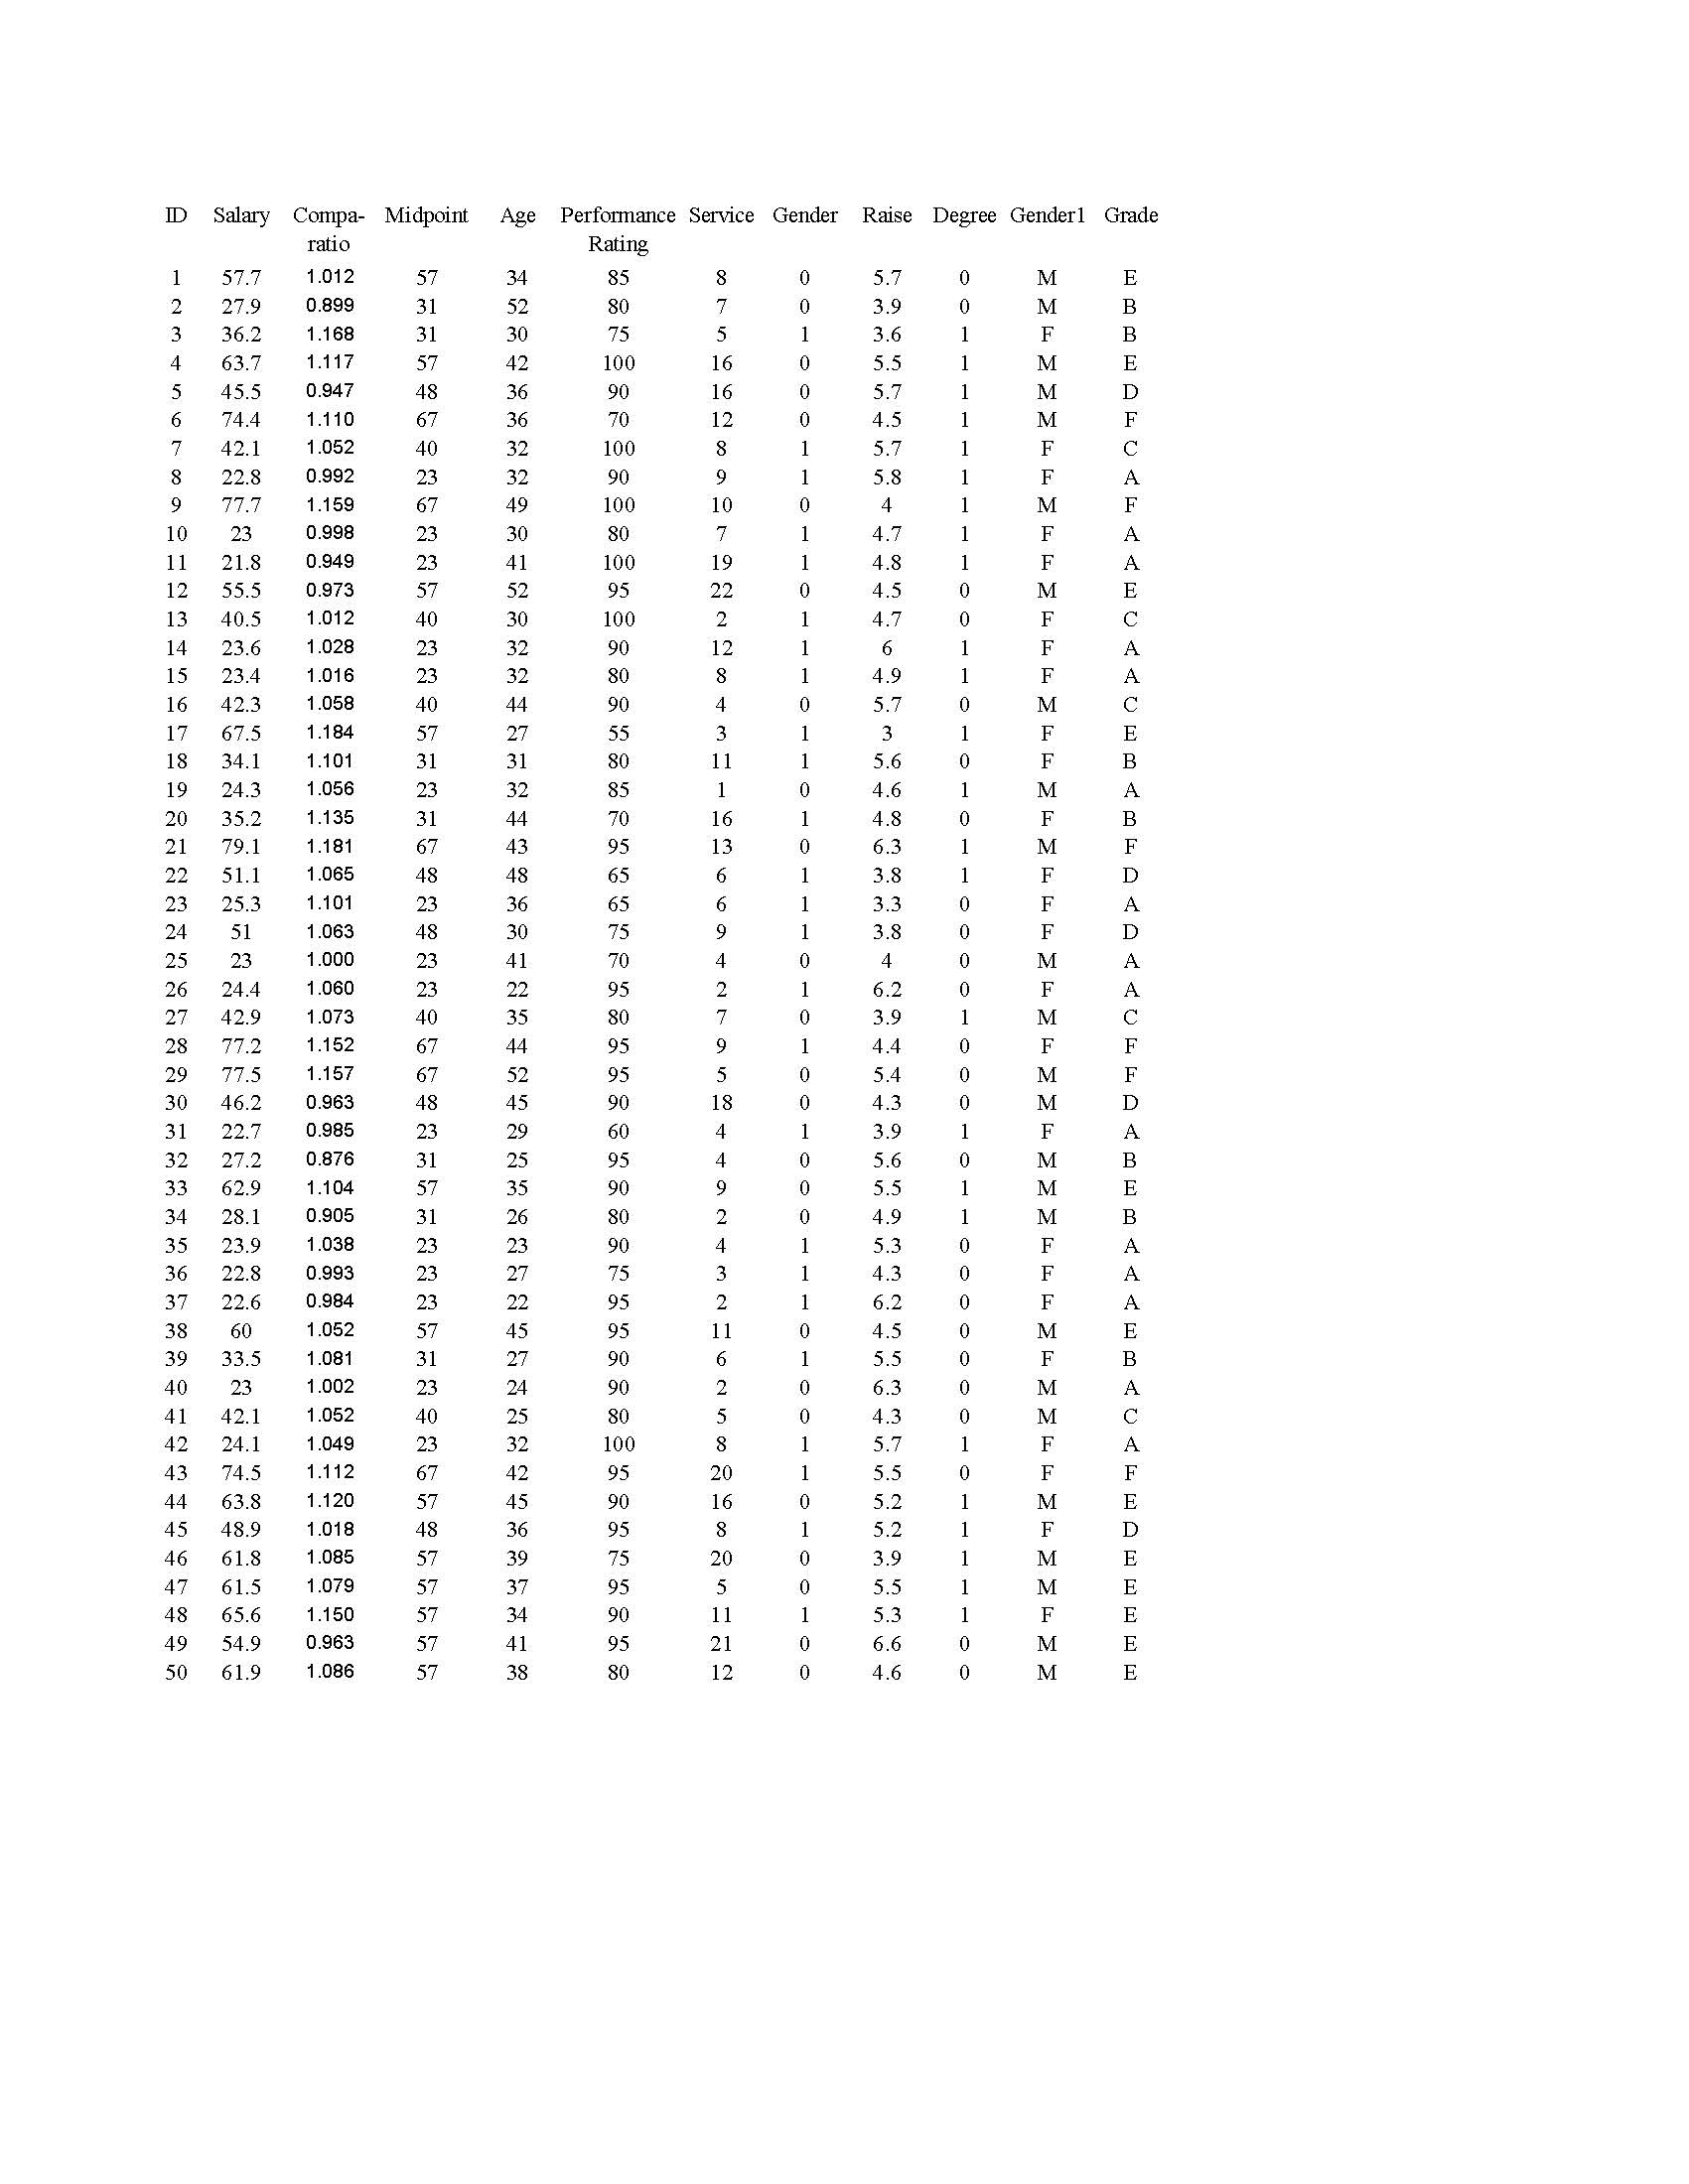
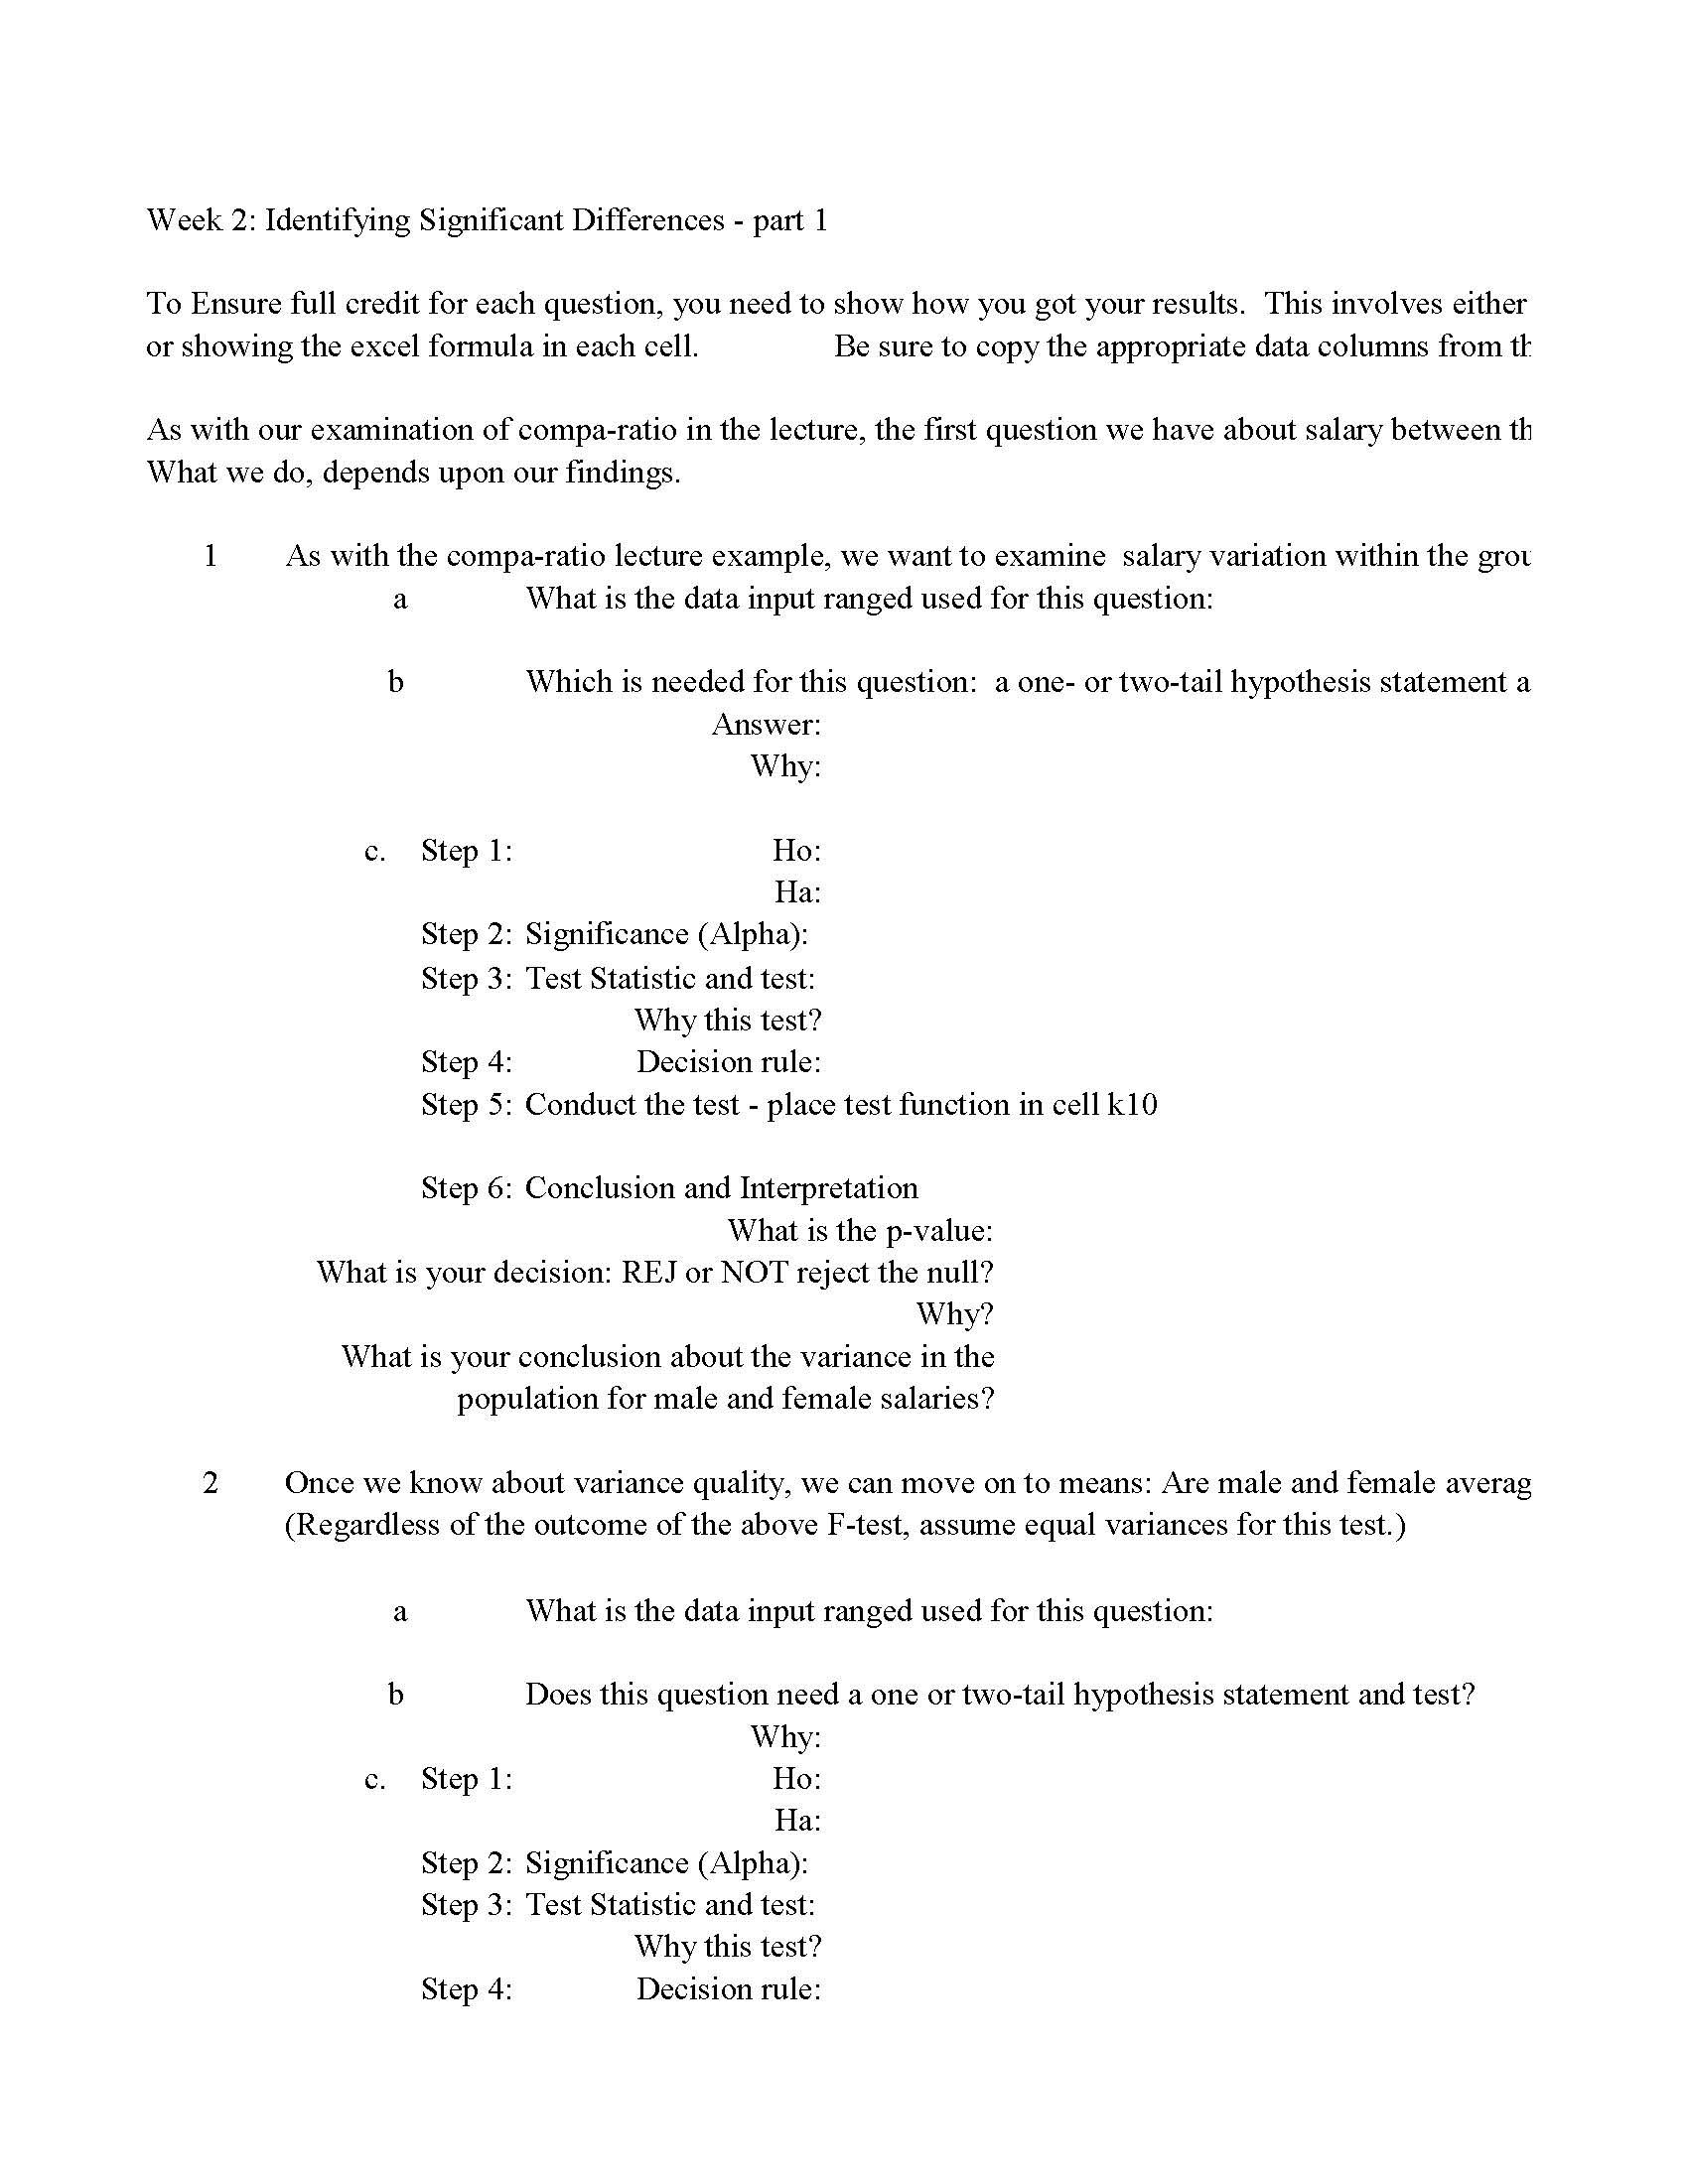
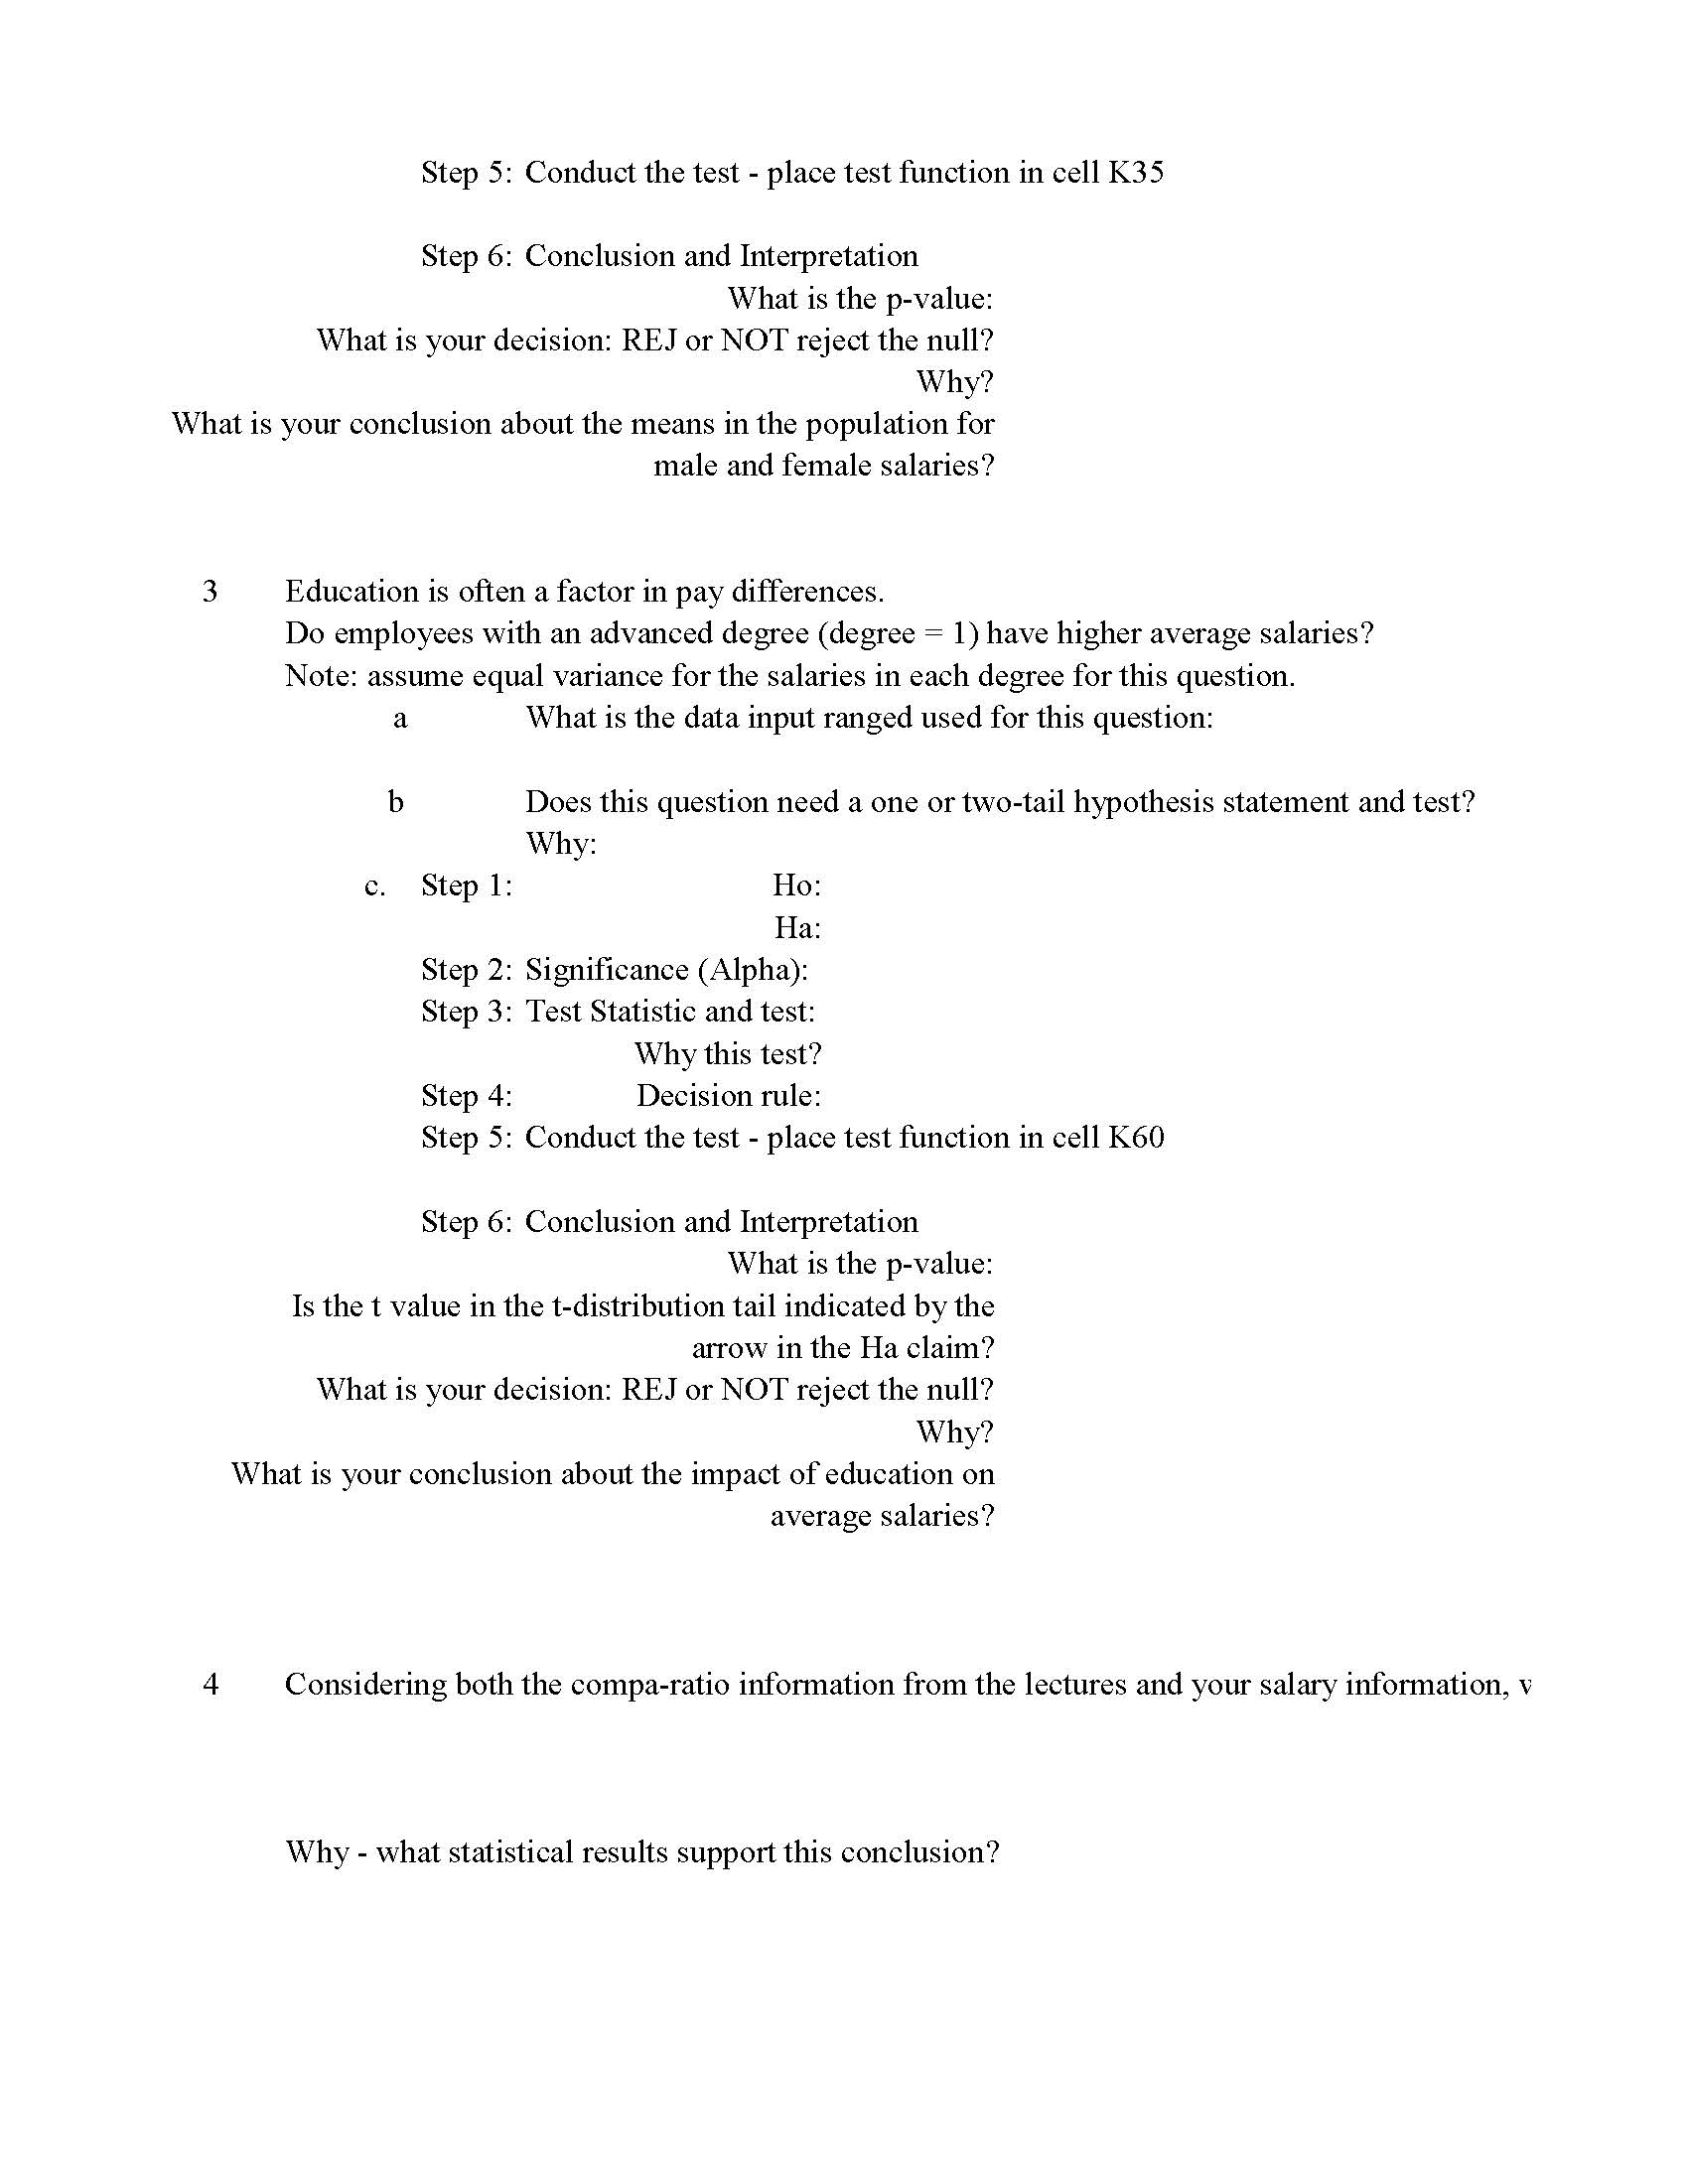
Good evening!I am enrolled in BUS 308, Statistics for Managers and I am having a difficult time with my homework.Attached is an excel document, the first two tabs are assignment data info used as needed on the assignment.The next tab is week two homework which I did not complete.I am requesting assistance on my week three homework today and if you are able to assist with week four, also on the bottom tab, I will open a new question to you for that assignment as well.Thank you.
ID Salary Compa- Midpoint Age Performance Service Gender Raise Degree Genderl Grade ratio Ratin 57.7 1.012 85 O C 27.9 0.899 $8 89 80 36.2 1.168 75 63.7 1.117 100 45.5 0.947 36 90 -HOOOH 74.4 .110 70 2.1 1.052 100 22.8 0.992 6 77.7 1.159 10 23 .998 OHHOH 11 21.8 0.949 55.5 .973 +OOH 13 40.5 .012 23.6 1.028 HH- 15 23.4 .016 16 42.3 1.058 17 67.5 18 34.1 1.184 1.101 19 24.3 .056 20 35.2 .135 21 79.1 1.181 51.1 1.065 23 25.3 1.101 25 51 1.063 OHOOOOHHOH 23 1.000 G YES TSUNOENWANA ASU ONNATHAN NOT GOTO 26 27 24.4 .060 42.9 1.073 28 77.2 .152 OHOOOH 29 77.5 1.157 OHHOHOHHHOHOHOOHOOOHHHOHOOH 30 46.2 0.963 22.7 .985 7.2 0.876 " OH 62.9 .104 34 28.1 .905 35 23.9 1.038 36 22.8 .993 22.6 0.984 ooooooOH 38 60 1.052 39 33.5 1.081 40 23 1.002 42.1 1.052 24.1 .049 1.112 44 53.8 .120 45 6 81 .018 1.8 .085 HHOHOOHOO 9t 47 61.5 .079 8t 65.6 .150 54.9 .963 OOHH 61 50 51.9 1.086Week 2 : Identifying Significant Differences - part ! To Ensure full credit for each question , you need to show how you got your results . This involves either or showing the excel formula in each cell .* Be sure to copy the appropriate data columns from the As with our examination of compa- ratio in the lecture , the first question we have about salary between the What we do , depends upon our findings . As with the compa-ratio lecture example , we want to examine salary variation within the grow What is the data input ranged used for this question :" b Which is needed for this question : a one - or two - tail hypothesis statement a Answer :" Why : C . Step 1 :` HO : Ha : Step 2 : Significance ( Alpha ) : Step 3 : Test Statistic and test :" Why this test ? Step 4 : Decision rule :" Step 5 : Conduct the test - place test function in cell klo Step 6 : Conclusion and Interpretation* What is the p- value :" What is your decision : RE. J or NOT reject the null ? Why ? What is your conclusion about the variance in the population for male and female salaries ? 2 Once we know about variance quality , we can move on to means : Are male and female average ( Regardless of the outcome of the above F-test , assume equal variances for this test . ) a What is the data input ranged used for this question :" D Does this question need a one or two - tail hypothesis statement and test ? Why : C. Step !` HO : Ha : Step 2 : Significance ( Alpha ) :` Step 3 : Test Statistic and test . Why this test ? Step 4 :` Decision rule :"Step 5 : Conduct the test - place test function in cell K 3 5 Step 6 : Conclusion and Interpretation* What is the p- value :" What is your decision : RE. J or NOT reject the null ? Why ? What is your conclusion about the means in the population for* male and female salaries ? 3 Education is often a factor in pay differences . Do employees with an advanced degree ( degree = 1 ) have higher average salaries ? Note : assume equal variance for the salaries in each degree for this question ." What is the data input ranged used for this question :" b Does this question need a one or two - tail hypothesis statement and test ?* Why : C . Step 1 : HO : Ha : Step 2 : Significance ( Alpha ) :` Step 3 : Test Statistic and test :" Why this test ? Step 4 : Decision rule : Step 5 : Conduct the test - place test function in cell K60 Step 6 : Conclusion and Interpretation* What is the p- value* Is the + value in the 1- distribution tail indicated by the arrow in the Ha claim ?' What is your decision : RE. J or NOT reject the null ? Why ? What is your conclusion about the impact of education on average salaries ? Considering both the compa - ratio information from the lectures and your salary information , " Why - what statistical results support this conclusion ?showing where the data you used is located 1e data tab to the right for your use this week. 1e genders involves equality - are they the same or different? lpS - are they equal? Use Cell K10 for the Excel test outcome location. |:| nd test ? ge salaries equal? Use Cell K35 for the Excel test outcome location. :l Use Cell K60 for the Excel test outcome location. |:| Vhat conclusions can you reach about equal pay for equal work


