Good evening!I am enrolled in BUS 308, Statistics for Managers and I am having a difficult time with my homework.
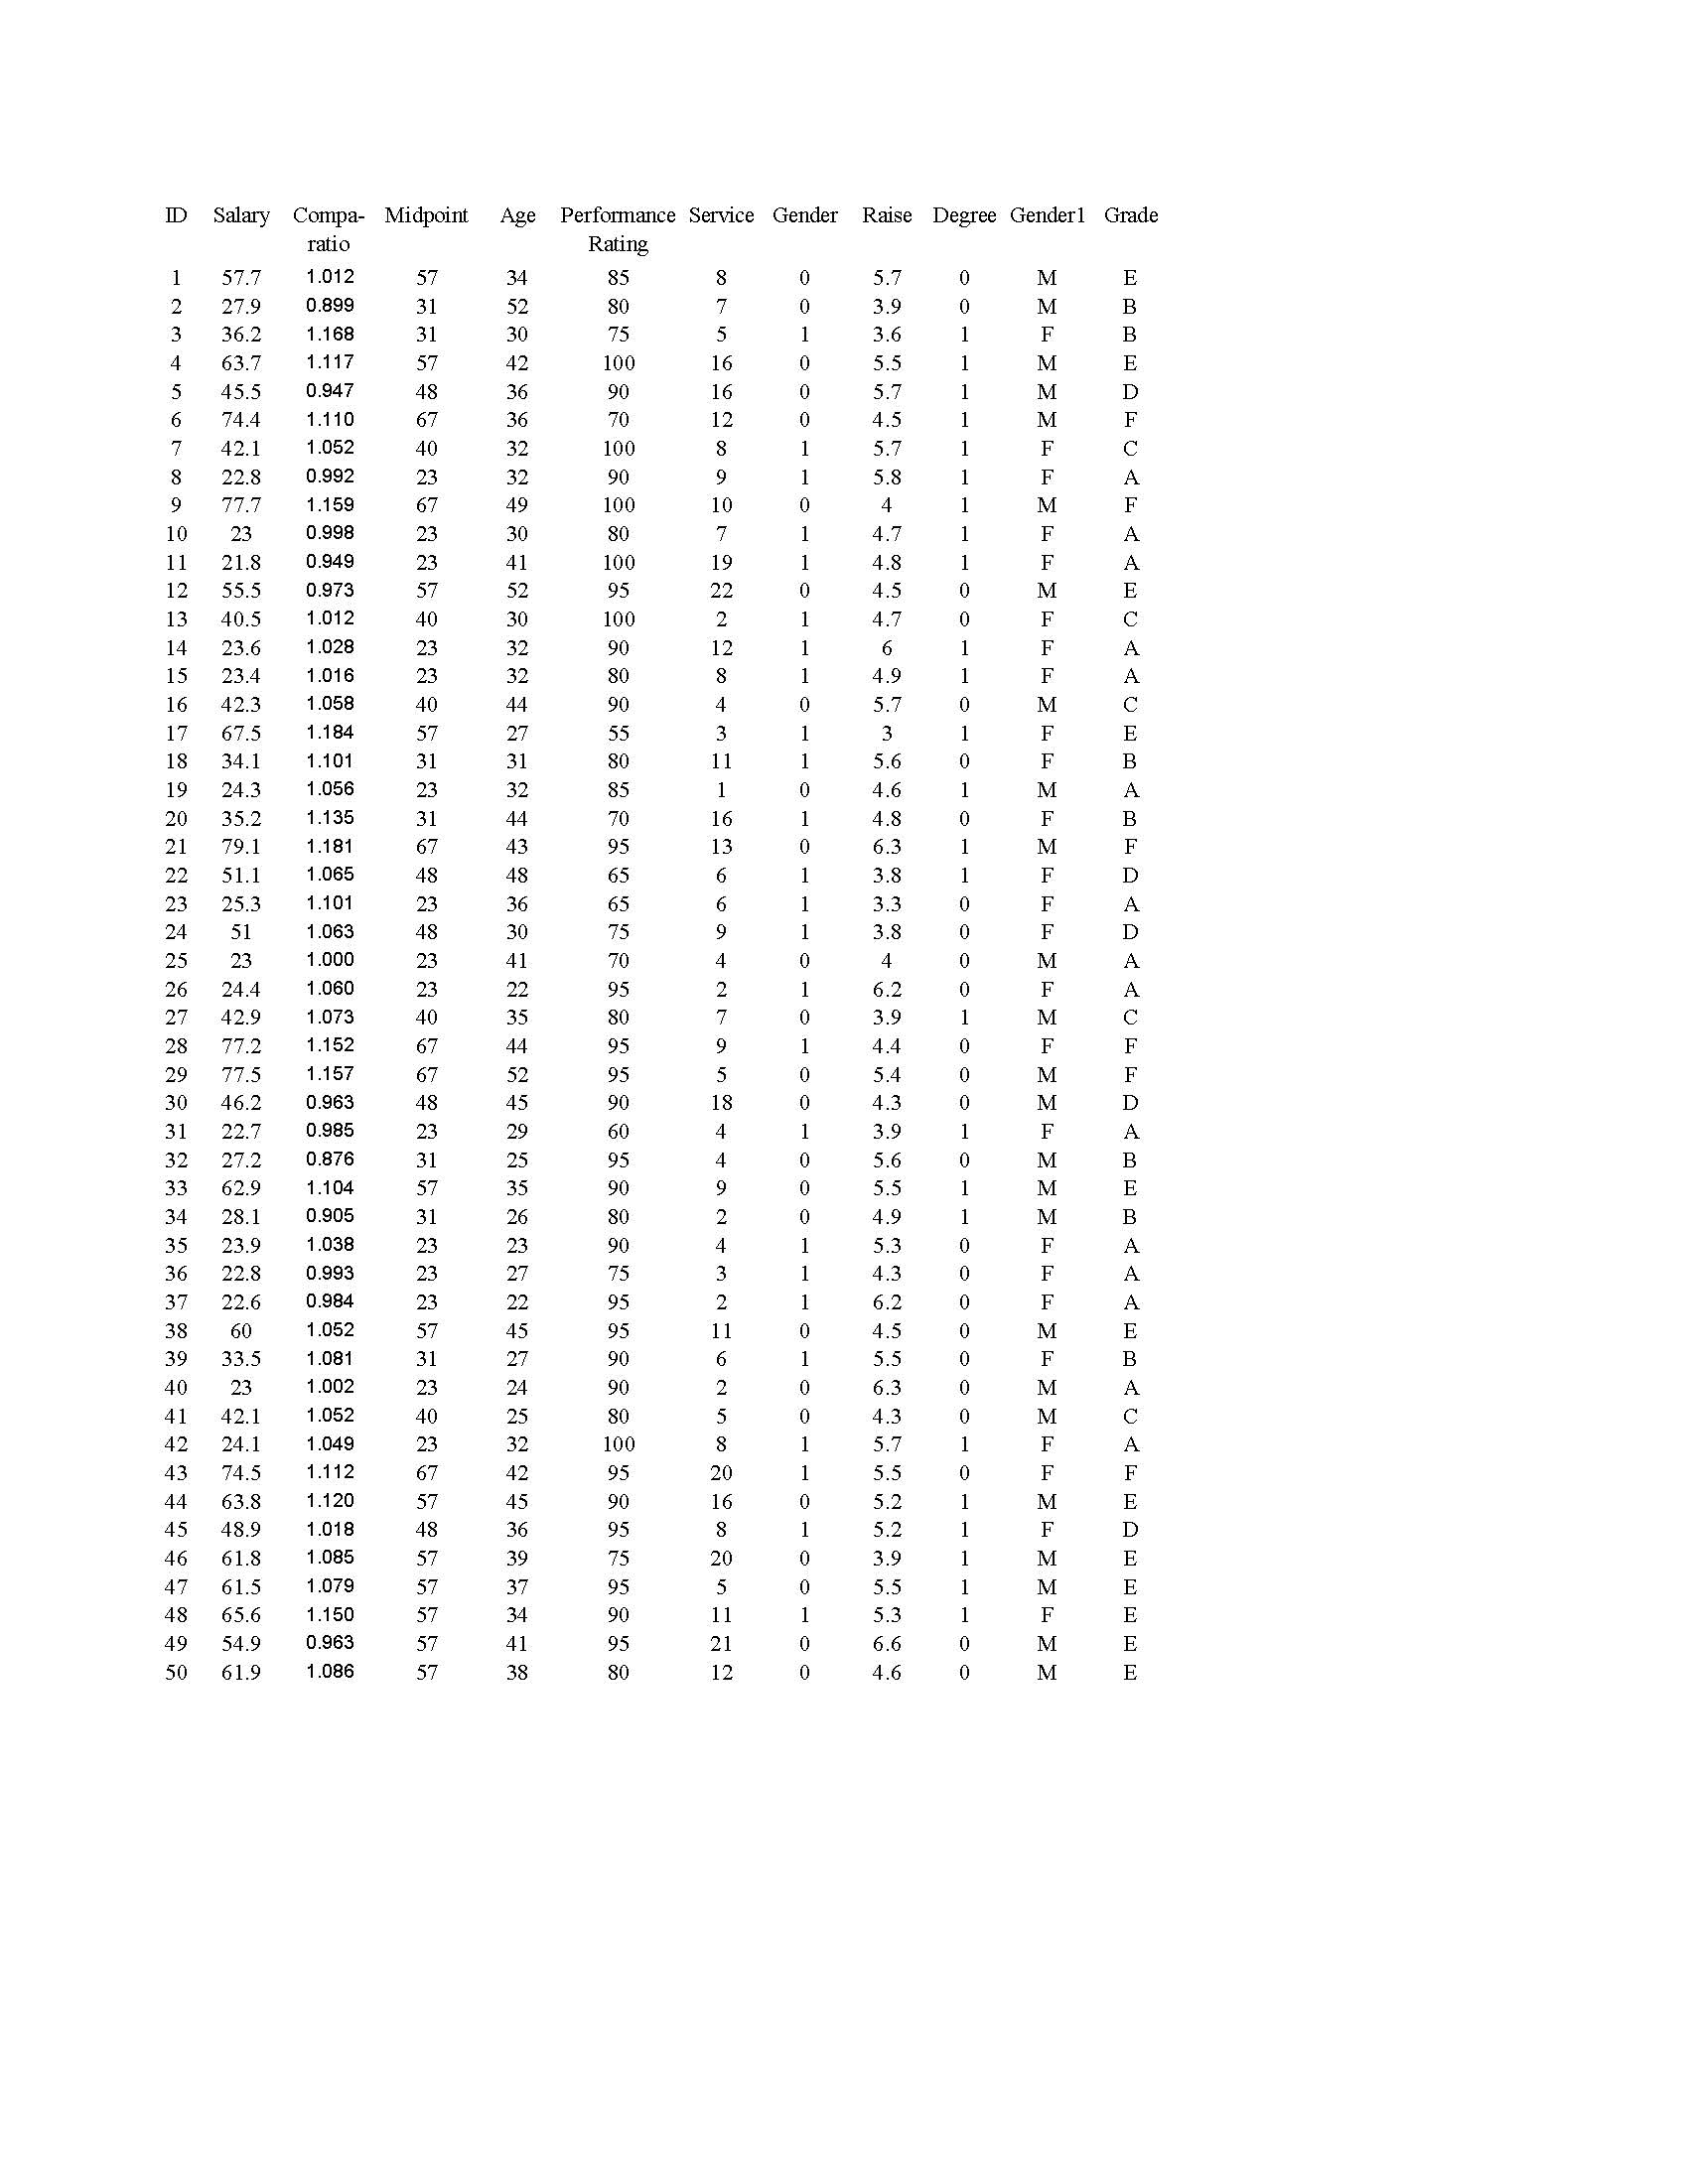
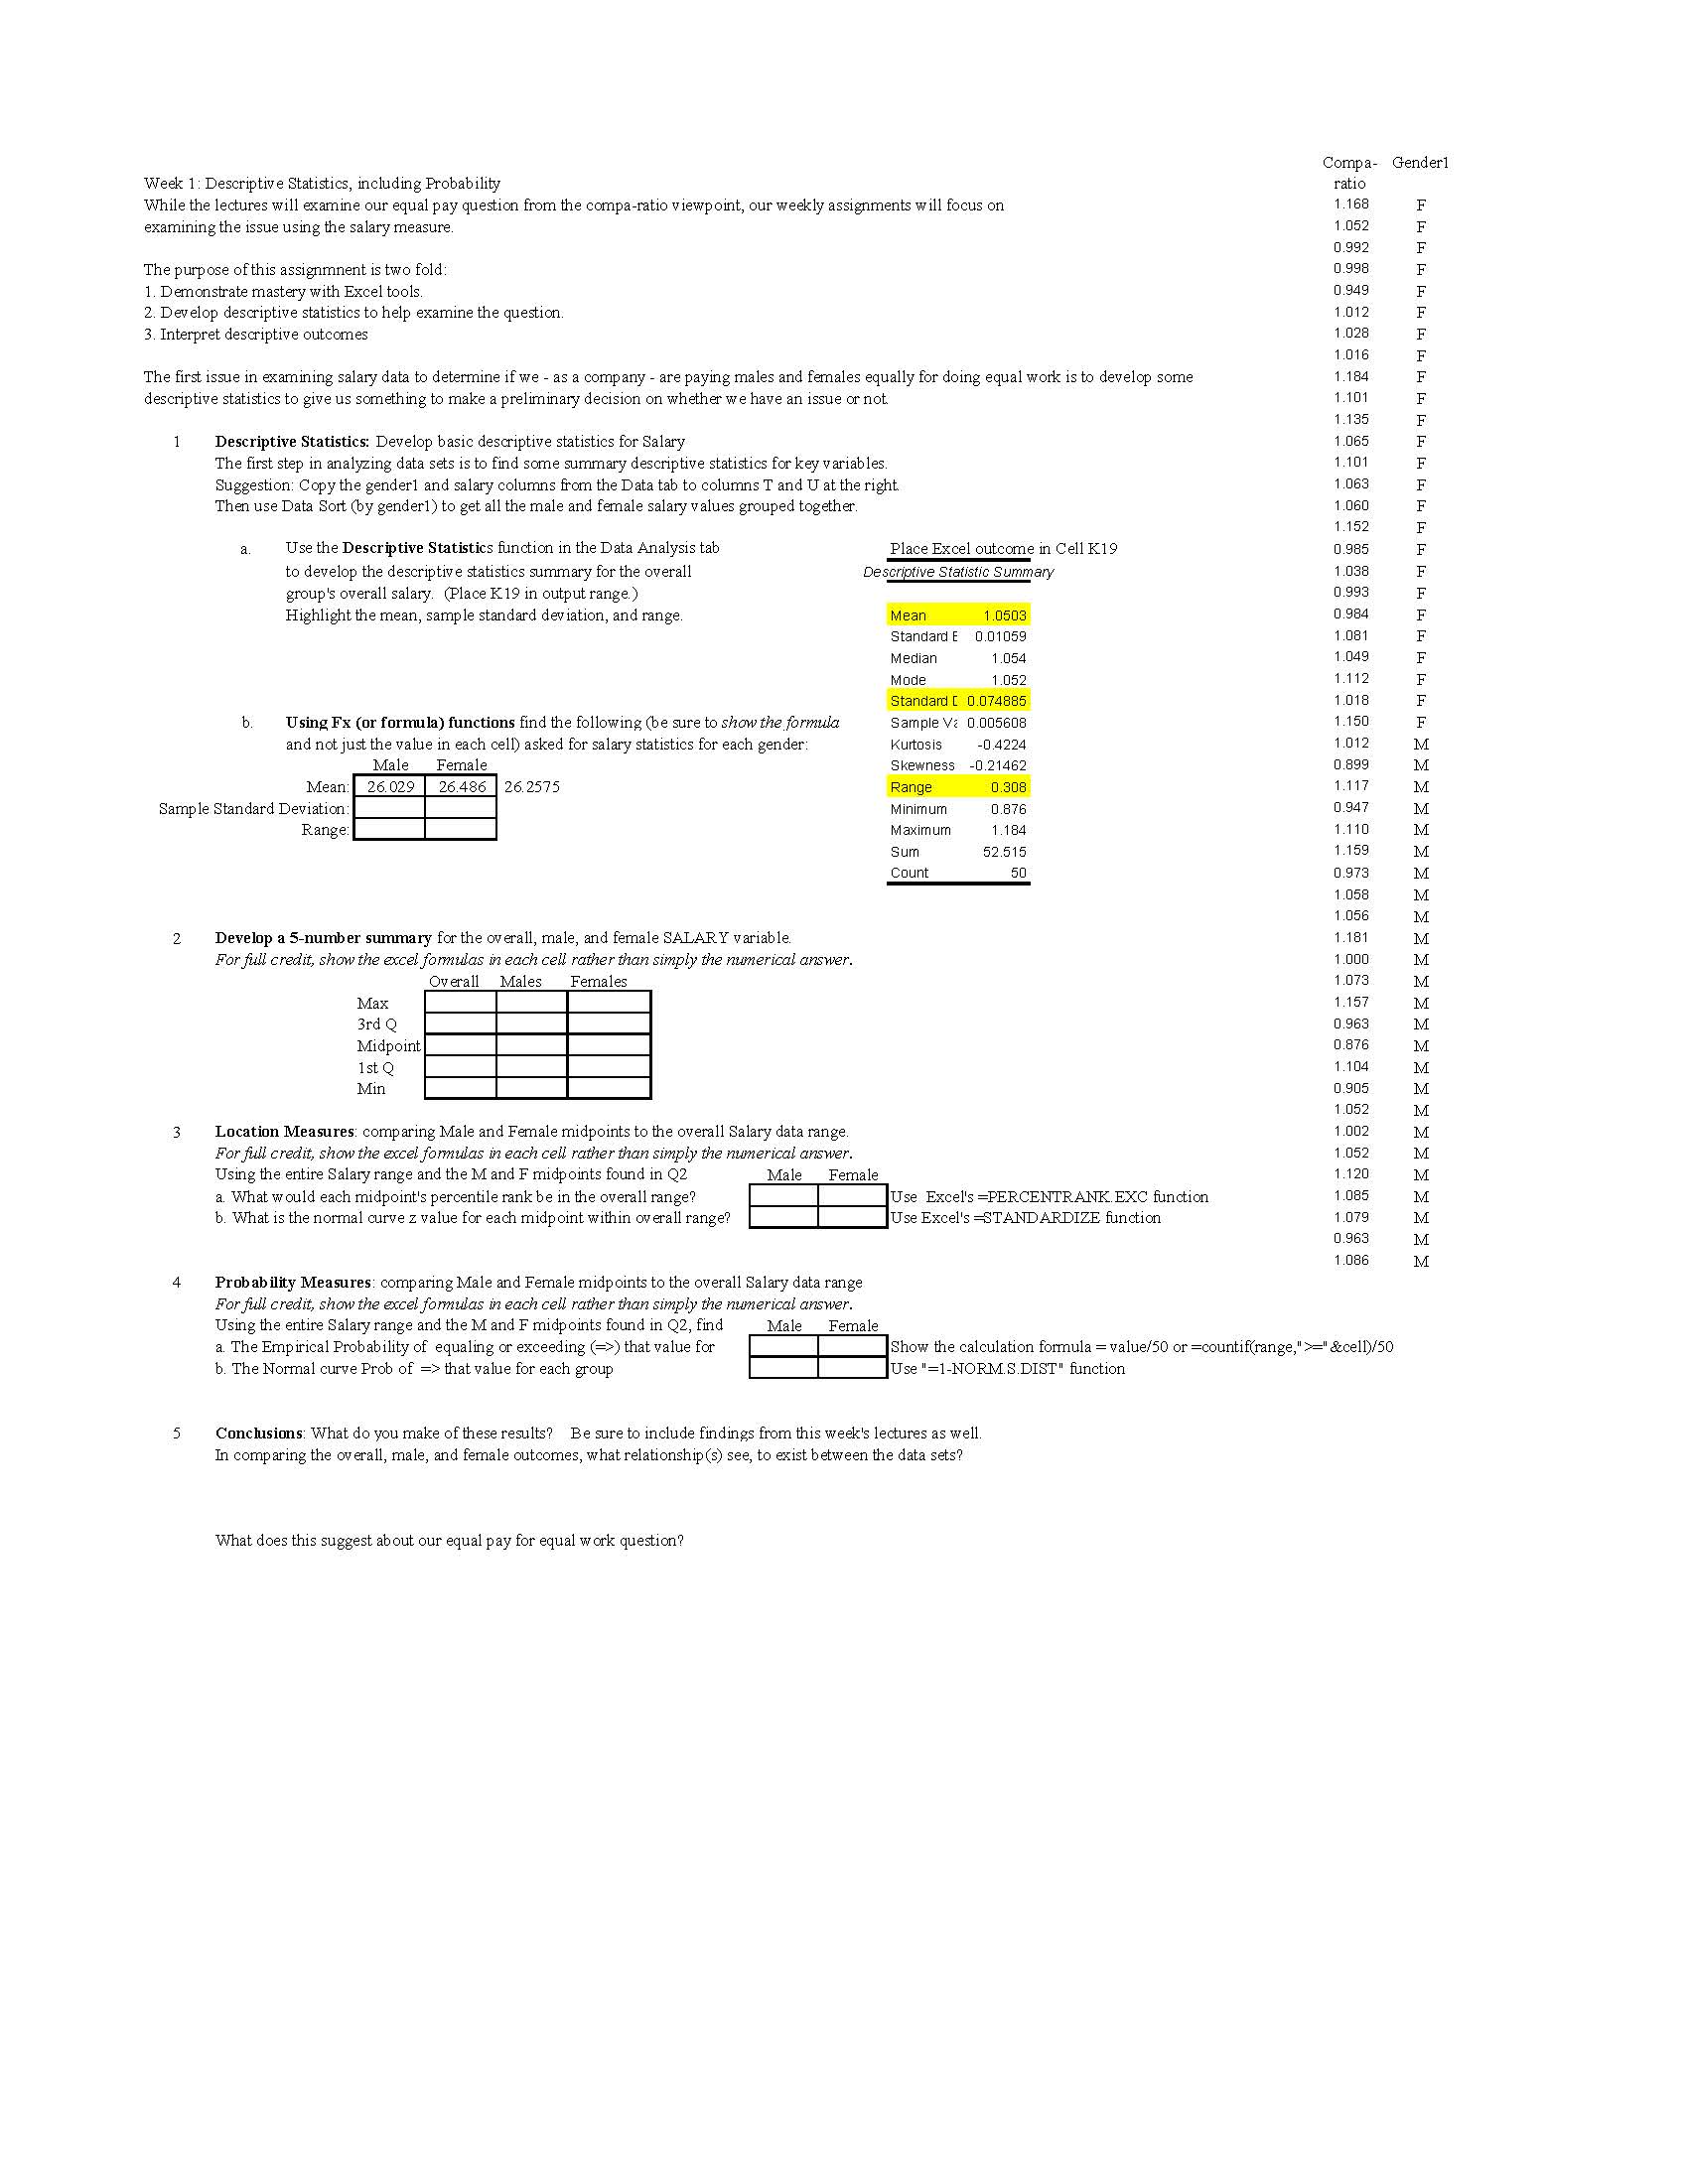
ID Salary Compa- Midpoint Age Performance Service Gender Raise Degree Genderl Grade ratio Ratin 57.7 1.012 85 O C 27.9 0.899 $8 89 80 36.2 1.168 75 63.7 1.117 100 45.5 0.947 36 90 -HOOOH 74.4 .110 70 2.1 1.052 100 22.8 0.992 6 77.7 1.159 10 23 .998 OHHOH 11 21.8 0.949 55.5 .973 +OOH 13 40.5 .012 23.6 1.028 HH- 15 23.4 .016 16 42.3 1.058 17 67.5 18 34.1 1.184 1.101 19 24.3 .056 20 35.2 .135 21 79.1 1.181 51.1 1.065 23 25.3 1.101 25 51 1.063 OHOOOOHHOH 23 1.000 G YES TSUNOENWANA ASU ONNATHAN NOT GOTO 26 27 24.4 .060 42.9 1.073 28 77.2 .152 OHOOOH 29 77.5 1.157 OHHOHOHHHOHOHOOHOOOHHHOHOOH 30 46.2 0.963 22.7 .985 7.2 0.876 " OH 62.9 .104 34 28.1 .905 35 23.9 1.038 36 22.8 .993 22.6 0.984 ooooooOH 38 60 1.052 39 33.5 1.081 40 23 1.002 42.1 1.052 24.1 .049 1.112 44 53.8 .120 45 6 81 .018 1.8 .085 HHOHOOHOO 9t 47 61.5 .079 8t 65.6 .150 54.9 .963 OOHH 61 50 51.9 1.086Compa - Gender!* Week 1 : Descriptive Statistics , Including Probability While the lectures will examine our equal pay question from the compa- ratio viewpoint , our weekly assignments will focus on ratio 1 . 1 68 examining the issue using the salary measure .* 1 . 052 1. 992 The purpose of this assignment is two fold :" 0.958 1 . Demonstrate mastery with Excel tools .` 1.949 2 . Develop descriptive statistics to help examine the question . 1.012 3 . Interpret descriptive outcomes* 1 . 02 8\\ 1.016 The first issue in examining salary data to determine if we - as a company - are paying males and females equally for doing equal work is to develop some* 1. 1 8. 4 descriptive statistics to give us something to make a preliminary decision on whether we have an issue or not .\\ 1 . 101 F 1 .135 \\1 Descriptive Statistics : Develop basic descriptive statistics for Salary\\ 1 . 065 The first step in analyzing data sets is to find some summary descriptive statistics for key variables . 1 . 1 01 Suggestion : Copy the gender! and salary columns from the Data tab to columns I and IT at the right 1. DEZ Then use Data Sort ( by gender! ; to get all the male and female salary values grouped together .\\ 1 .060 1. 152 Use the Descriptive Statistics function in the Data Analysis tab to develop the descriptive statistics summary for the overall { lace Excel outcome in Cell EIS 0 . 985 Descriptive Static Summary 1 .038 group's overall salary . ( Place


