

Answered step by step
Verified Expert Solution
Question
1 Approved Answer
GRAP HELP 1 Cost-Volume-Profit Analysis 2 Using Excel for Cost-Volume-Profit (CVP) Analysis 3 The Oceanside Garden Nursery buys flowering plants in four-inch pots for $1.50
GRAP HELP 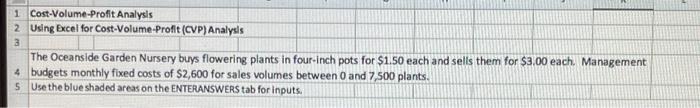
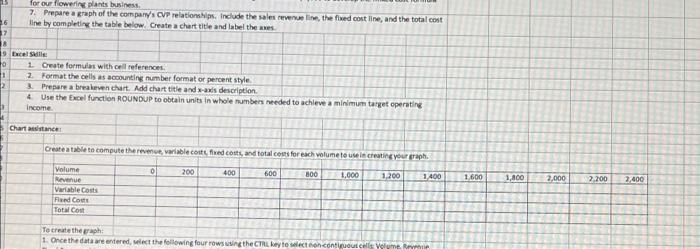
1 Cost-Volume-Profit Analysis 2 Using Excel for Cost-Volume-Profit (CVP) Analysis 3 The Oceanside Garden Nursery buys flowering plants in four-inch pots for $1.50 each and sells them for $3.00 each. Management 4 budgets monthly fixed costs of $2,600 for sales volumes between 0 and 7,500 plants. 5 Use the blue shaded areas on the ENTERANSWERS tab for inputs. 26 37 for our flowering plants business. 7. Prepare a graph of the company's CVP relationships. Include the sales revenue line, the fixed cost line, and the total cost line by completing the table below. Create a chart title and label the axes A 19 Excel Skills: 0 1 Create formulas with cell references. 1 2 D H 2. Format the cells as accounting number format or percent style. 3. Prepare a breakeven chart. Add chart title and x-axis description. 4 Use the Excel function ROUNDUP to obtain units in whole numbers needed to achieve a minimum target operating income. Chart assistance: Create a table to compute the revenue, variable costs, fixed costs, and total costs for each volume to use in creating your graph. Volume 1,200 Revenue Variable Costs Fixed Costs Total Cost 0 200 400 600 800 To create the graph: 1. Once the data are entered, select the following four rows using the CTRL key to select non 1,000 1,400 guous cells Volume Rrymin 1,600 1,800 2,000 2,200 2,400 1 Cost-Volume-Profit Analysis 2 Using Excel for Cost-Volume-Profit (CVP) Analysis 3 The Oceanside Garden Nursery buys flowering plants in four-inch pots for $1.50 each and sells them for $3.00 each. Management 4 budgets monthly fixed costs of $2,600 for sales volumes between 0 and 7,500 plants. 5 Use the blue shaded areas on the ENTERANSWERS tab for inputs. 26 37 for our flowering plants business. 7. Prepare a graph of the company's CVP relationships. Include the sales revenue line, the fixed cost line, and the total cost line by completing the table below. Create a chart title and label the axes A 19 Excel Skills: 0 1 Create formulas with cell references. 1 2 D H 2. Format the cells as accounting number format or percent style. 3. Prepare a breakeven chart. Add chart title and x-axis description. 4 Use the Excel function ROUNDUP to obtain units in whole numbers needed to achieve a minimum target operating income. Chart assistance: Create a table to compute the revenue, variable costs, fixed costs, and total costs for each volume to use in creating your graph. Volume 1,200 Revenue Variable Costs Fixed Costs Total Cost 0 200 400 600 800 To create the graph: 1. Once the data are entered, select the following four rows using the CTRL key to select non 1,000 1,400 guous cells Volume Rrymin 1,600 1,800 2,000 2,200 2,400 Step by Step Solution
There are 3 Steps involved in it
Step: 1

Get Instant Access to Expert-Tailored Solutions
See step-by-step solutions with expert insights and AI powered tools for academic success
Step: 2

Step: 3
Ace Your Homework with AI
Get the answers you need in no time with our AI-driven, step-by-step assistance
Get Started
Hospitality Financial Accounting
Authors: Neville Joffe
1st Edition
1926751531, 978-1926751535