Answered step by step
Verified Expert Solution
Question
1 Approved Answer
Graph the final payoff and value prior to expiry of the following portfolio: Long underlying stock purchased at price So = 100 Long put

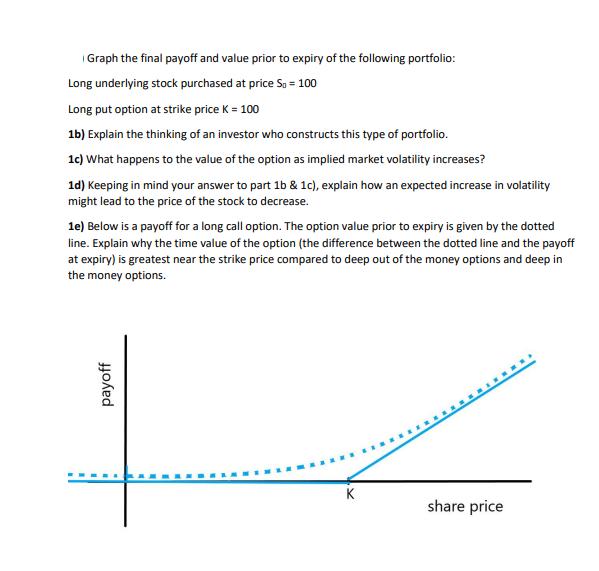
Graph the final payoff and value prior to expiry of the following portfolio: Long underlying stock purchased at price So = 100 Long put option at strike price K = 100 1b) Explain the thinking of an investor who constructs this type of portfolio. 1c) What happens to the value of the option as implied market volatility increases? 1d) Keeping in mind your answer to part 1b & 1c), explain how an expected increase in volatility might lead to the price of the stock to decrease. 1e) Below is a payoff for a long call option. The option value prior to expiry is given by the dotted line. Explain why the time value of the option (the difference between the dotted line and the payoff at expiry) is greatest near the strike price compared to deep out of the money options and deep in the money options. payoff share price
Step by Step Solution
★★★★★
3.60 Rating (157 Votes )
There are 3 Steps involved in it
Step: 1
Portfolio Long Stock Long Put Graph The payoff graph for a long stock and long put option portfolio with a strike price K of 100 and underlying stock ...
Get Instant Access to Expert-Tailored Solutions
See step-by-step solutions with expert insights and AI powered tools for academic success
Step: 2

Step: 3

Ace Your Homework with AI
Get the answers you need in no time with our AI-driven, step-by-step assistance
Get Started


