Answered step by step
Verified Expert Solution
Question
1 Approved Answer
. Graph the following positions at expiration, putting combined profit of the position on the vertical axis and stock price at expiration on the


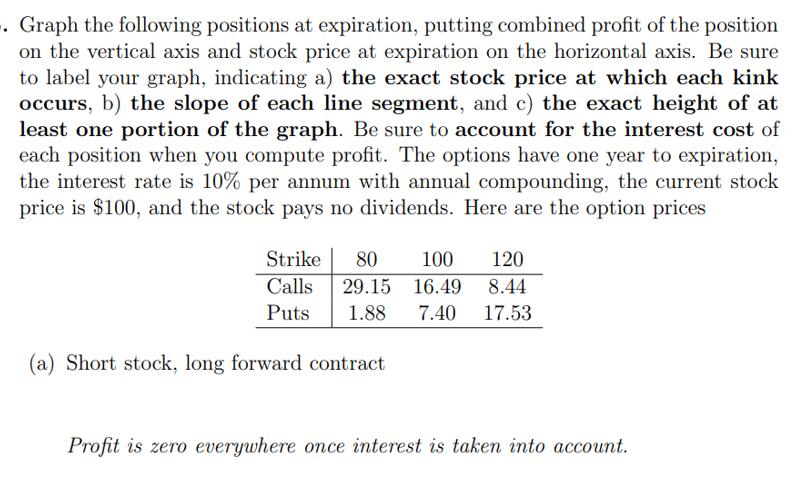
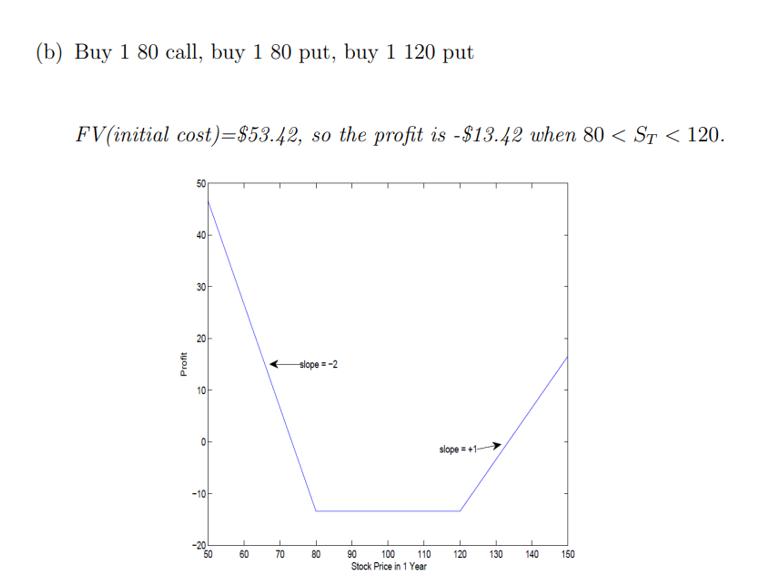
. Graph the following positions at expiration, putting combined profit of the position on the vertical axis and stock price at expiration on the horizontal axis. Be sure to label your graph, indicating a) the exact stock price at which each kink occurs, b) the slope of each line segment, and c) the exact height of at least one portion of the graph. Be sure to account for the interest cost of each position when you compute profit. The options have one year to expiration, the interest rate is 10% per annum with annual compounding, the current stock price is $100, and the stock pays no dividends. Here are the option prices Strike 80 100 120 Calls 29.15 16.49 8.44 1.88 7.40 17.53 Puts (a) Short stock, long forward contract Profit is zero everywhere once interest is taken into account.
Step by Step Solution
★★★★★
3.30 Rating (147 Votes )
There are 3 Steps involved in it
Step: 1
Answer 1A 1B Initial outlay of funds when you purchase ...
Get Instant Access to Expert-Tailored Solutions
See step-by-step solutions with expert insights and AI powered tools for academic success
Step: 2

Step: 3

Ace Your Homework with AI
Get the answers you need in no time with our AI-driven, step-by-step assistance
Get Started


