

Answered step by step
Verified Expert Solution
Question
1 Approved Answer
Graph the given function using a chart of values. (Use -3 x 3.) g(x) = 8(3x) 200 y 100 autosave#question3969792_2 y 200 100 X
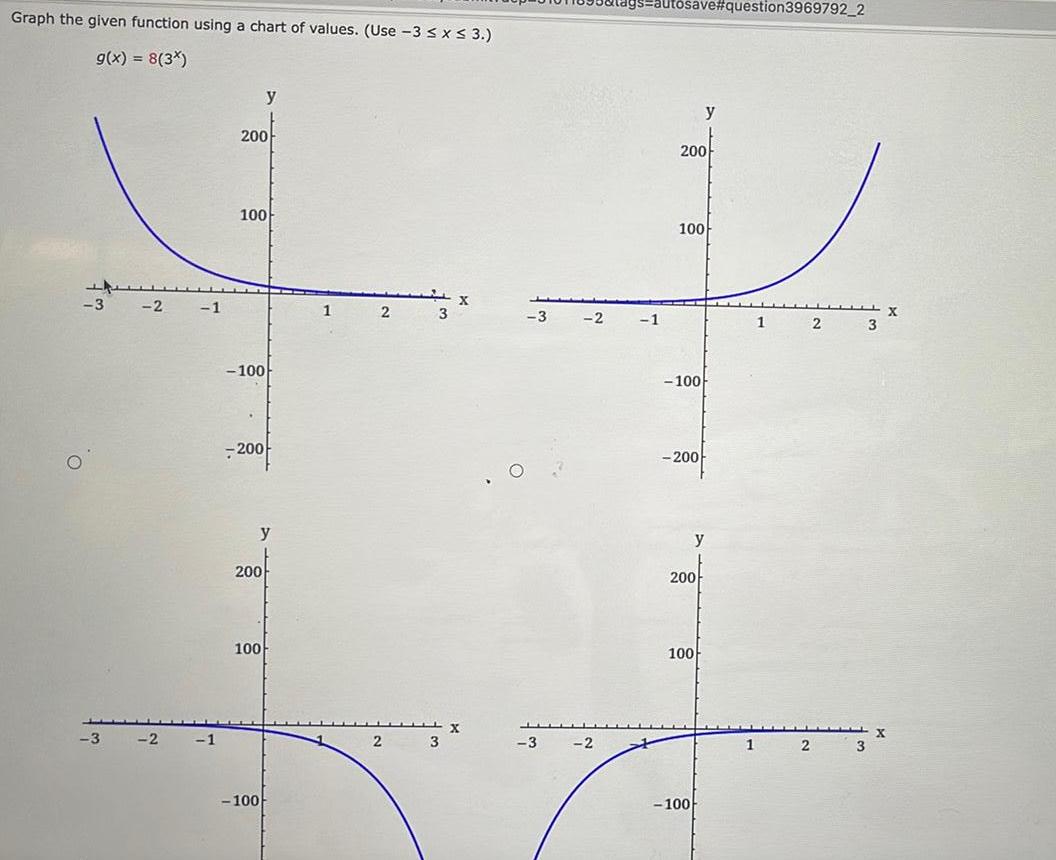
Graph the given function using a chart of values. (Use -3 x 3.) g(x) = 8(3x) 200 y 100 autosave#question3969792_2 y 200 100 X -3 -2 -1 1 2 3 -3 -2 -1 1 2 3 -3 -2 -1 -100 -200 y 200 100 -100 2 3 -3 -2 -100 -200 y 200- 100 -100 1 2 3
Step by Step Solution
There are 3 Steps involved in it
Step: 1

Get Instant Access to Expert-Tailored Solutions
See step-by-step solutions with expert insights and AI powered tools for academic success
Step: 2

Step: 3
Ace Your Homework with AI
Get the answers you need in no time with our AI-driven, step-by-step assistance
Get Started
Fractal Functions, Fractal Surfaces, And Wavelets
Authors: Peter R Massopust
2nd Edition
0128044705, 9780128044704