Question
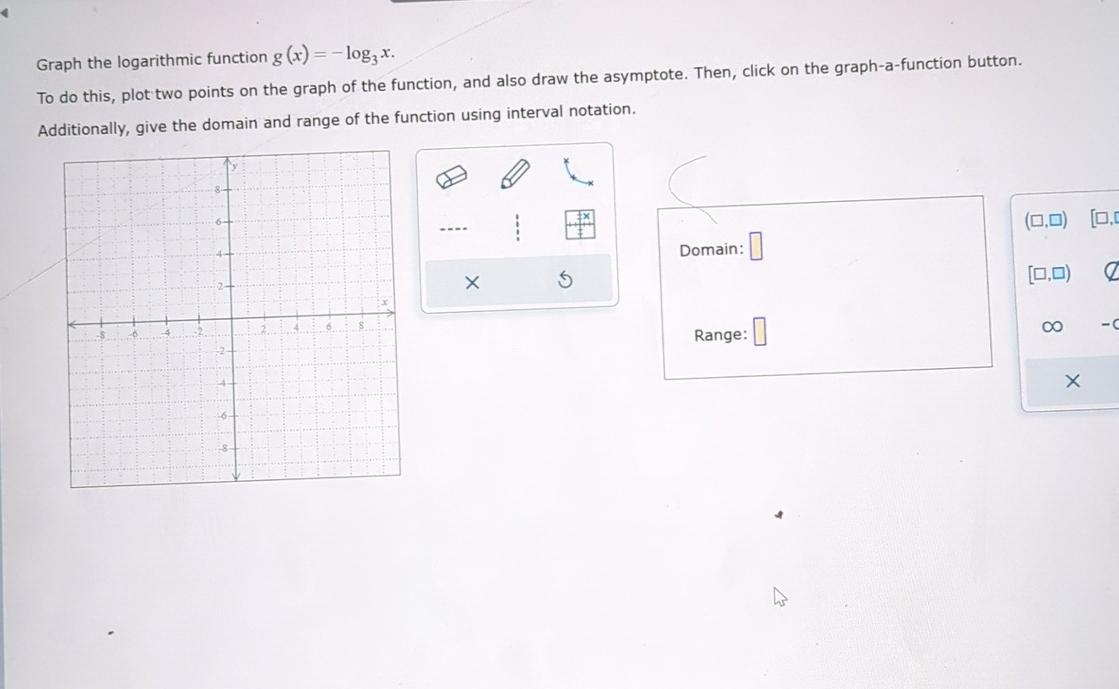
Graph the logarithmic function g (x) = -log3x. To do this, plot two points on the graph of the function, and also draw the

Graph the logarithmic function g (x) = -log3x. To do this, plot two points on the graph of the function, and also draw the asymptote. Then, click on the graph-a-function button. Additionally, give the domain and range of the function using interval notation. X G (0.0) [0 Domain: (0,0) Range: 8 X
Step by Step Solution
There are 3 Steps involved in it
Step: 1

Get Instant Access to Expert-Tailored Solutions
See step-by-step solutions with expert insights and AI powered tools for academic success
Step: 2

Step: 3

Ace Your Homework with AI
Get the answers you need in no time with our AI-driven, step-by-step assistance
Get StartedRecommended Textbook for
College Algebra
Authors: Michael Sullivan, Michael Sullivan III
11th Edition
0135226864, 9780135226865
Students also viewed these Mathematics questions
Question
Answered: 1 week ago
Question
Answered: 1 week ago
Question
Answered: 1 week ago
Question
Answered: 1 week ago
Question
Answered: 1 week ago
Question
Answered: 1 week ago
Question
Answered: 1 week ago
Question
Answered: 1 week ago
Question
Answered: 1 week ago
Question
Answered: 1 week ago
Question
Answered: 1 week ago
Question
Answered: 1 week ago
Question
Answered: 1 week ago
Question
Answered: 1 week ago
Question
Answered: 1 week ago
Question
Answered: 1 week ago
Question
Answered: 1 week ago
Question
Answered: 1 week ago
Question
Answered: 1 week ago
Question
Answered: 1 week ago
View Answer in SolutionInn App


