

Answered step by step
Verified Expert Solution
Question
1 Approved Answer
Graph the trigonometric function. 1 - sin(x 2 Plot all points corresponding to minima and maxima within one cycle. Within that cycle, also plot
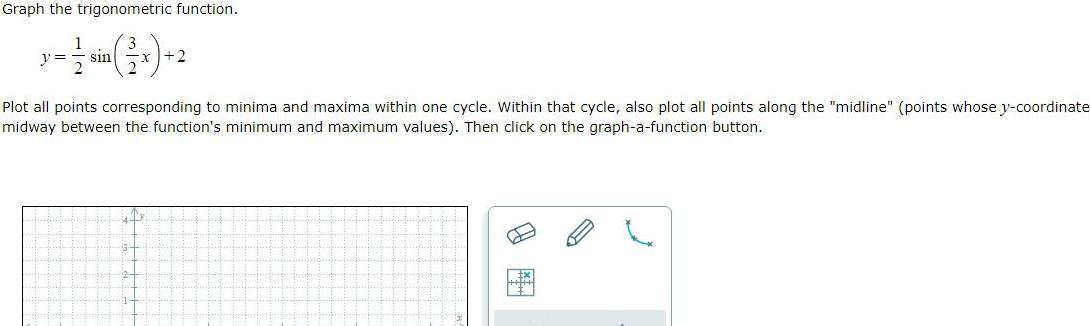
Graph the trigonometric function. 1 - sin(x 2 Plot all points corresponding to minima and maxima within one cycle. Within that cycle, also plot all points along the "midline" (points whose y-coordinate midway between the function's minimum and maximum values). Then click on the graph-a-function button.
Step by Step Solution
There are 3 Steps involved in it
Step: 1

Get Instant Access to Expert-Tailored Solutions
See step-by-step solutions with expert insights and AI powered tools for academic success
Step: 2

Step: 3
Ace Your Homework with AI
Get the answers you need in no time with our AI-driven, step-by-step assistance
Get Started
Analysis Of Ordinal Categorical Data
Authors: Alan Agresti
2nd Edition
0470082895, 978-0470082898