Answered step by step
Verified Expert Solution
Question
1 Approved Answer
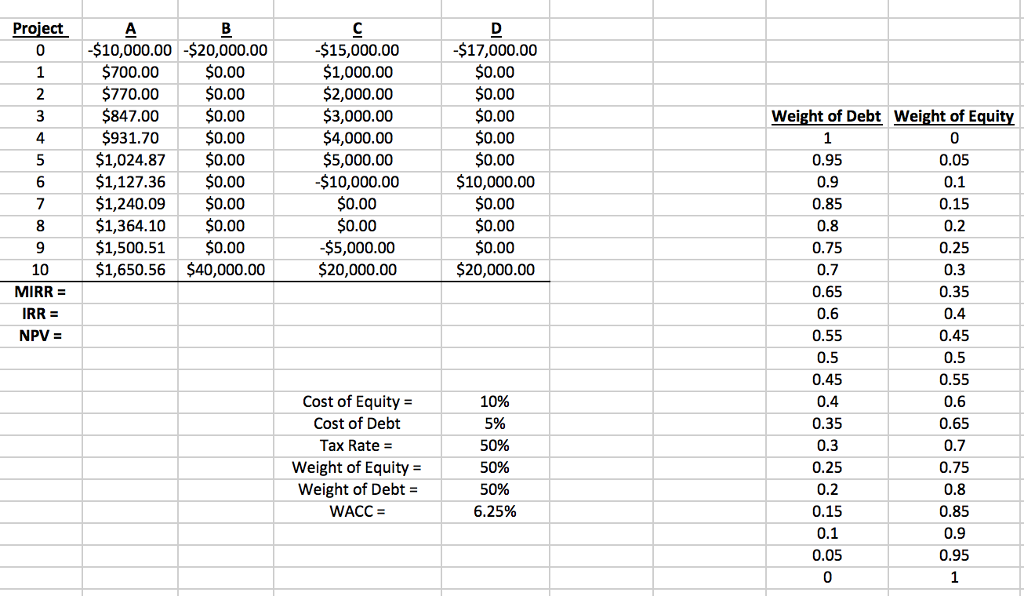
Graph the WACC on a graph allowing the weights of debt and equity to shift from 0 to 100%. The x axis should be the
Graph the WACC on a graph allowing the weights of debt and equity to shift from 0 to 100%. The x axis should be the weights and the y should be the WACC. Use increments of .05.
Now allow the tax rate to go to zero, what happens to your graph (paste it here).

Step by Step Solution
There are 3 Steps involved in it
Step: 1

Get Instant Access to Expert-Tailored Solutions
See step-by-step solutions with expert insights and AI powered tools for academic success
Step: 2

Step: 3

Ace Your Homework with AI
Get the answers you need in no time with our AI-driven, step-by-step assistance
Get Started


