Question
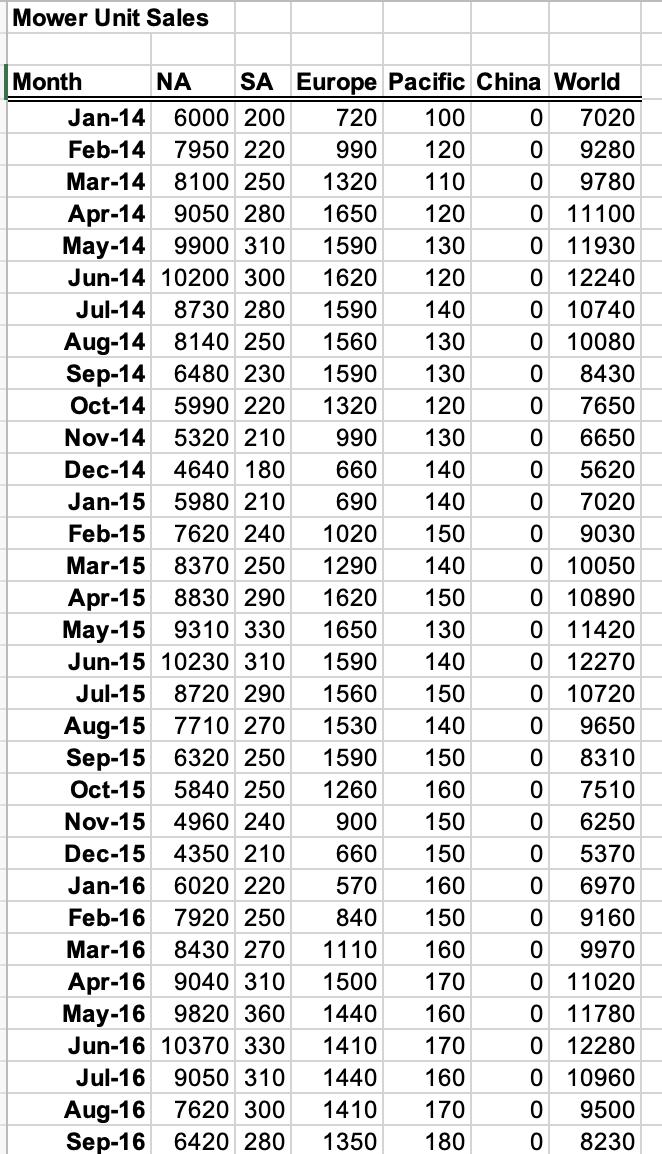
GROSS SALES BY MONTH AND REGION BICYCLE (GROSS SALES = UNIT SALES PER YEAR * UNIT PRICE PER YEAR) Create a PIE Chart for
 GROSS SALES BY MONTH AND REGION
BICYCLE (GROSS SALES = UNIT SALES PER YEAR * UNIT PRICE PER YEAR)

Create a PIE Chart for YEAR 2018 of total units sold by region using Excel.
B. Elizabeth wants to know the market share for each product and region by month with the use of the Industry Motorcycle Total Sales and Industry Bicycle Total Sales worksheets, and the average market share by region over the five years. Chart Part A and Part B (on an annual basis) in your report and interpret the data, commenting on sales trends and market share trends.
Step by Step Solution
3.37 Rating (153 Votes )
There are 3 Steps involved in it
Step: 1
Here is a pie chart created in Excel showing the breakdown of total units sold by reg...
Get Instant Access to Expert-Tailored Solutions
See step-by-step solutions with expert insights and AI powered tools for academic success
Step: 2

Step: 3

Ace Your Homework with AI
Get the answers you need in no time with our AI-driven, step-by-step assistance
Get StartedRecommended Textbook for
Business Communication Developing Leaders for a Networked World
Authors: Peter Cardon
2nd edition
9814714658, 978-0073403281, 73403288, 978-9814714655
Students also viewed these Accounting questions
Question
Answered: 1 week ago
Question
Answered: 1 week ago
Question
Answered: 1 week ago
Question
Answered: 1 week ago
Question
Answered: 1 week ago
Question
Answered: 1 week ago
Question
Answered: 1 week ago
Question
Answered: 1 week ago
Question
Answered: 1 week ago
Question
Answered: 1 week ago
Question
Answered: 1 week ago
Question
Answered: 1 week ago
Question
Answered: 1 week ago
Question
Answered: 1 week ago
Question
Answered: 1 week ago
Question
Answered: 1 week ago
Question
Answered: 1 week ago
Question
Answered: 1 week ago
Question
Answered: 1 week ago
Question
Answered: 1 week ago
Question
Answered: 1 week ago
Question
Answered: 1 week ago
Question
Answered: 1 week ago
View Answer in SolutionInn App


