Question
Group #1 Discussion Topic: Combining Quantitative and Communication Skills ( LO 12.1 , LO 12.4 , LO 12.5 , LO 12.6 ) Lloyd C. Blankfein,
Group #1 Discussion Topic:
Combining Quantitative and Communication Skills (LO 12.1, LO 12.4, LO 12.5, LO 12.6)
Lloyd C. Blankfein, chair and CEO of Goldman Sachs, was asked, "What would you like business schools to teach more of, or less of?" He responded:
Look, I think it's very important to teach people to have a healthy respect for facts and information. And you know, to paraphrase Keynes, "to change minds when facts change." That's why I think certain careers—and maybe not intuitive careers—do very well. There's a lot of lawyers floating around Wall Street. There's a lot of engineers. A lot of people who deal in facts and have an appreciation for facts. A quantitative thing is very helpful. I was a social studies major, but you need to be numerate. If you have those good quantitative skills, it's very, very helpful.6
Based on Blankfein's comments and your own opinions, respond to 2-3 of the following questions:
Why are quantitative skills so highly valued in various business disciplines?
How important do you think quantitative skills will be to your career? In what ways?
What are your strongest areas in terms of quantitative skills? Weakest areas?
What are your strongest areas in terms of spreadsheet software? Weakest areas?
What are five goals you have for improving your quantitative skills?
 \
\
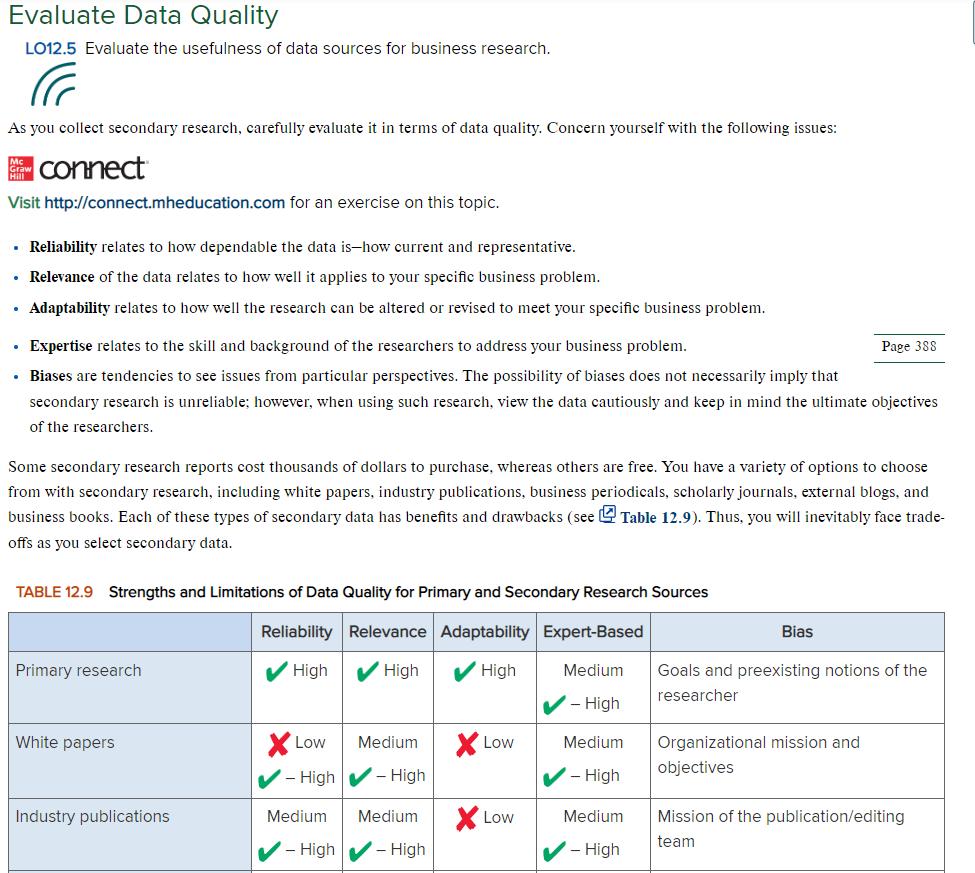
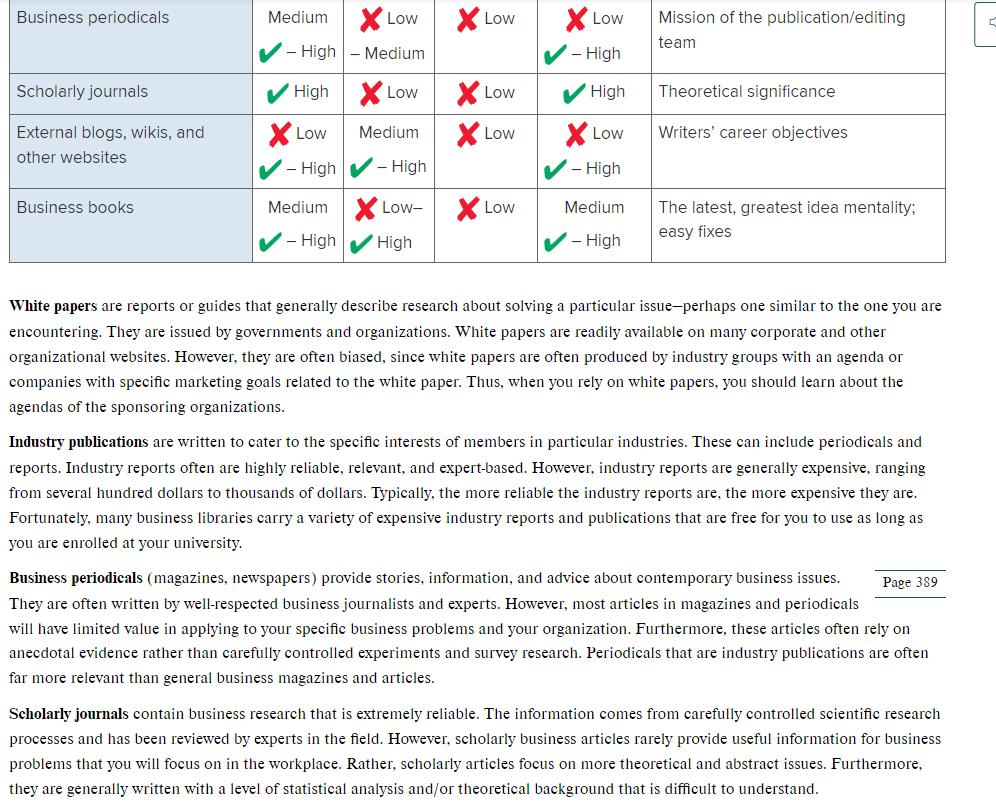
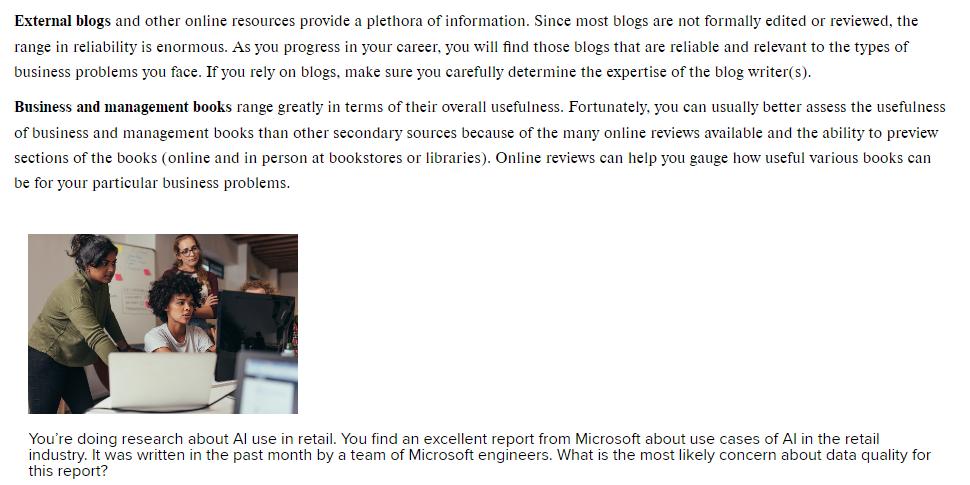
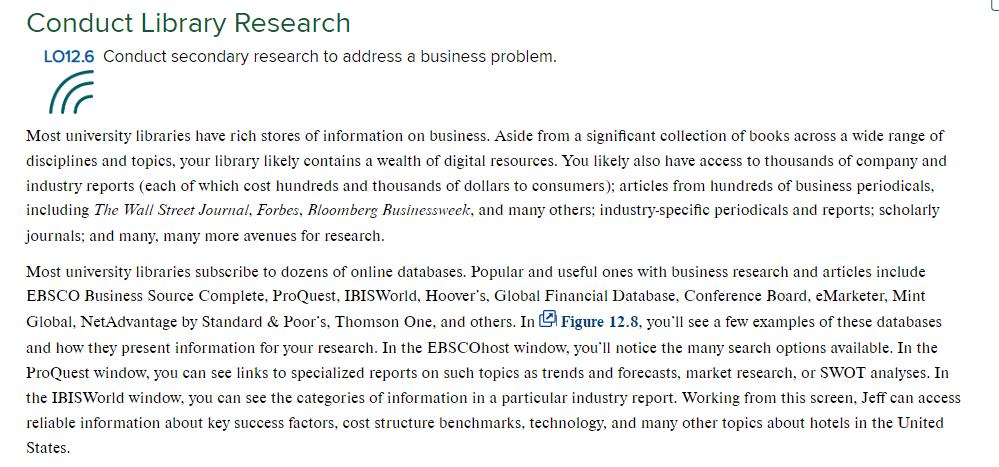
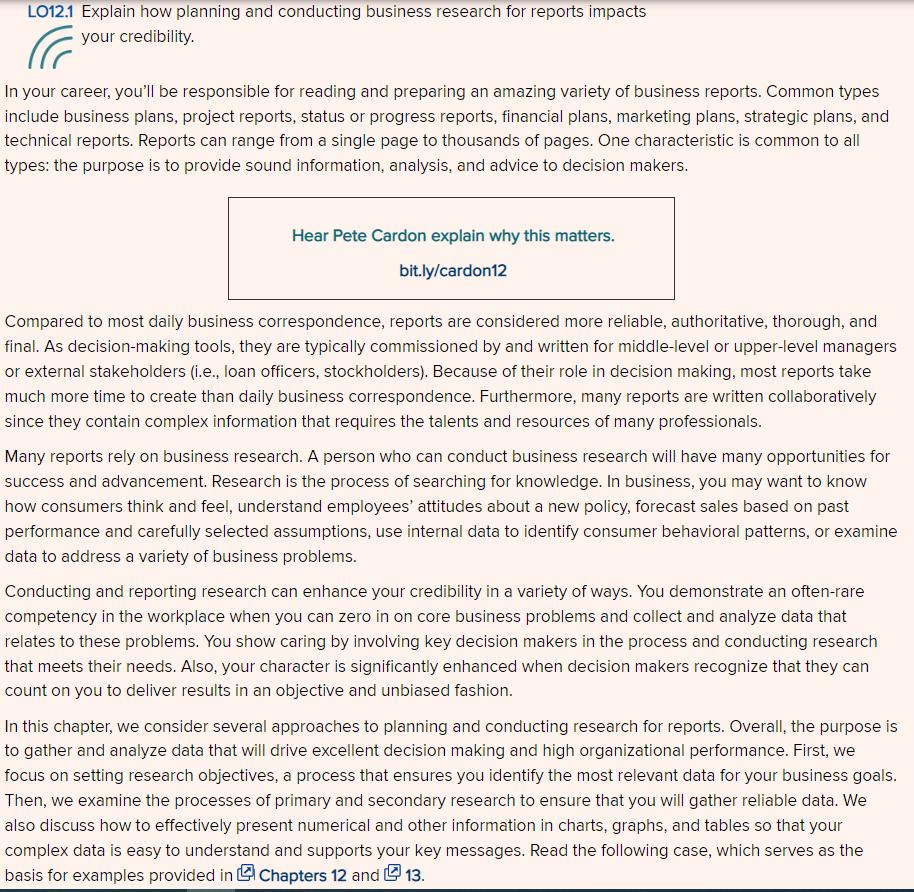
LO12.1 Explain how planning and conducting business research for reports impacts your credibility. In your career, you'll be responsible for reading and preparing an amazing variety of business reports. Common types include business plans, project reports, status or progress reports, financial plans, marketing plans, strategic plans, and technical reports. Reports can range from a single page to thousands of pages. One characteristic is common to all types: the purpose is to provide sound information, analysis, and advice to decision makers. Hear Pete Cardon explain why this matters. bit.ly/cardon12 Compared to most daily business correspondence, reports are considered more reliable, authoritative, thorough, and final. As decision-making tools, they are typically commissioned by and written for middle-level or upper-level managers or external stakeholders (i.e., loan officers, stockholders). Because of their role in decision making, most reports take much more time to create than daily business correspondence. Furthermore, many reports are written collaboratively since they contain complex information that requires the talents and resources of many professionals. Many reports rely on business research. A person who can conduct business research will have many opportunities for success and advancement. Research is the process of searching for knowledge. In business, you may want to know how consumers think and feel, understand employees' attitudes about a new policy, forecast sales based on past performance and carefully selected assumptions, use internal data to identify consumer behavioral patterns, or examine data to address a variety of business problems. Conducting and reporting research can enhance your credibility in a variety of ways. You demonstrate an often-rare competency in the workplace when you can zero in on core business problems and collect and analyze data that relates to these problems. You show caring by involving key decision makers in the process and conducting research that meets their needs. Also, your character is significantly enhanced when decision makers recognize that they can count on you to deliver results in an objective and unbiased fashion. In this chapter, we consider several approaches to planning and conducting research for reports. Overall, the purpose is to gather and analyze data that will drive excellent decision making and high organizational performance. First, we focus on setting research objectives, a process that ensures you identify the most relevant data for your business goals. Then, we examine the processes of primary and secondary research to ensure that you will gather reliable data. We also discuss how to effectively present numerical and other information in charts, graphs, and tables so that your complex data is easy to understand and supports your key messages. Read the following case, which serves as the basis for examples provided in Chapters 12 and 13.
Step by Step Solution
There are 3 Steps involved in it
Step: 1

Get Instant Access to Expert-Tailored Solutions
See step-by-step solutions with expert insights and AI powered tools for academic success
Step: 2

Step: 3

Ace Your Homework with AI
Get the answers you need in no time with our AI-driven, step-by-step assistance
Get Started


