

Answered step by step
Verified Expert Solution
Question
1 Approved Answer
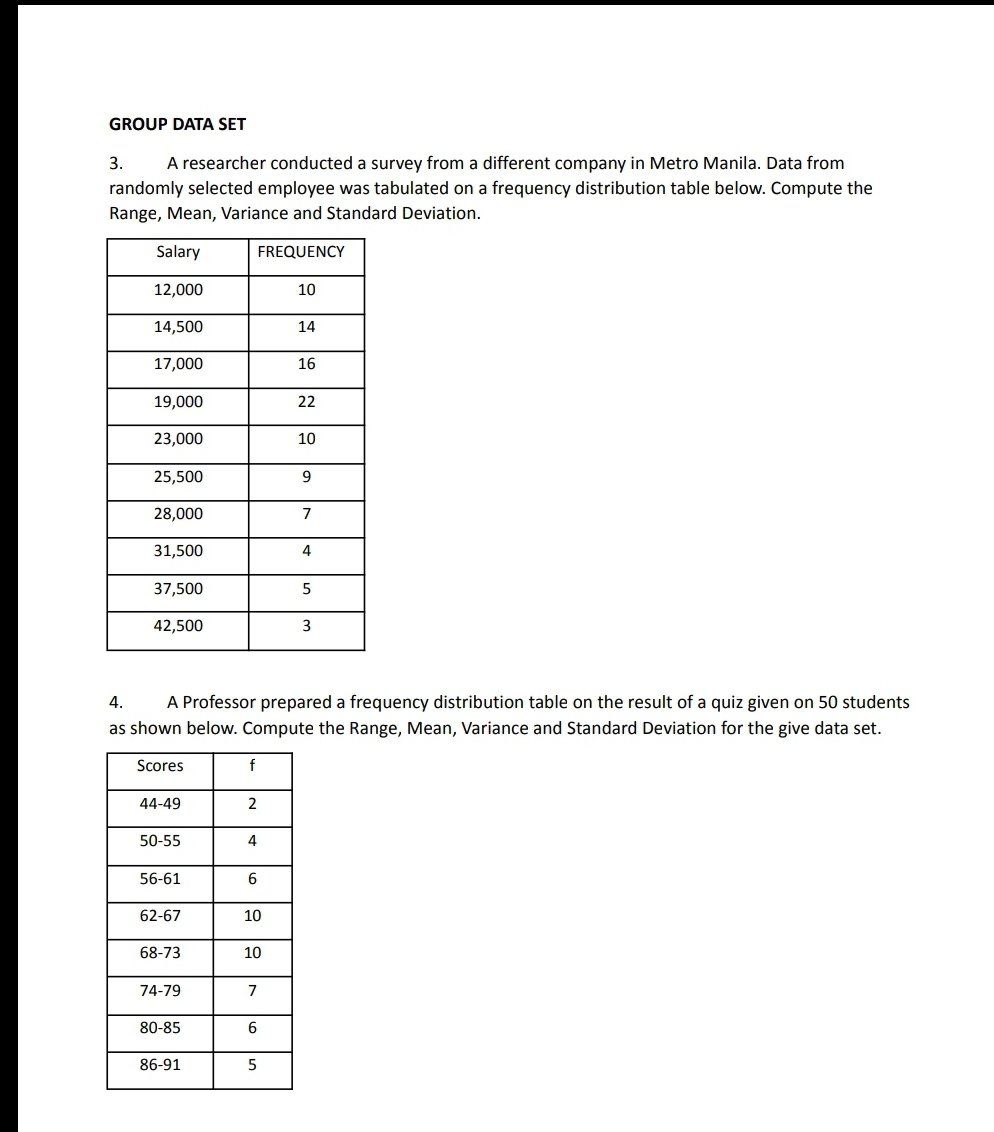
GROUP DATA SET 3. A researcher conducted a survey from a different company in Metro Manila. Data from randomly selected employee was tabulated on a

Step by Step Solution
There are 3 Steps involved in it
Step: 1

Get Instant Access to Expert-Tailored Solutions
See step-by-step solutions with expert insights and AI powered tools for academic success
Step: 2

Step: 3
Ace Your Homework with AI
Get the answers you need in no time with our AI-driven, step-by-step assistance
Get Started
College Algebra
Authors: Michael Sullivan, Michael Sullivan III
11th Edition
0135226864, 9780135226865