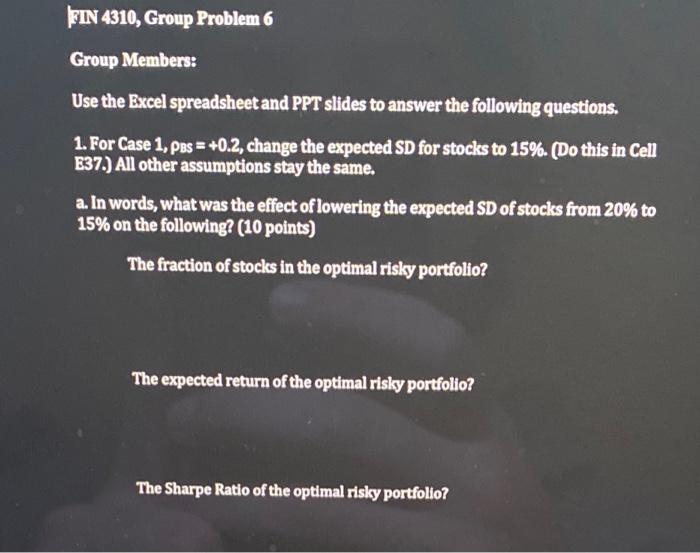
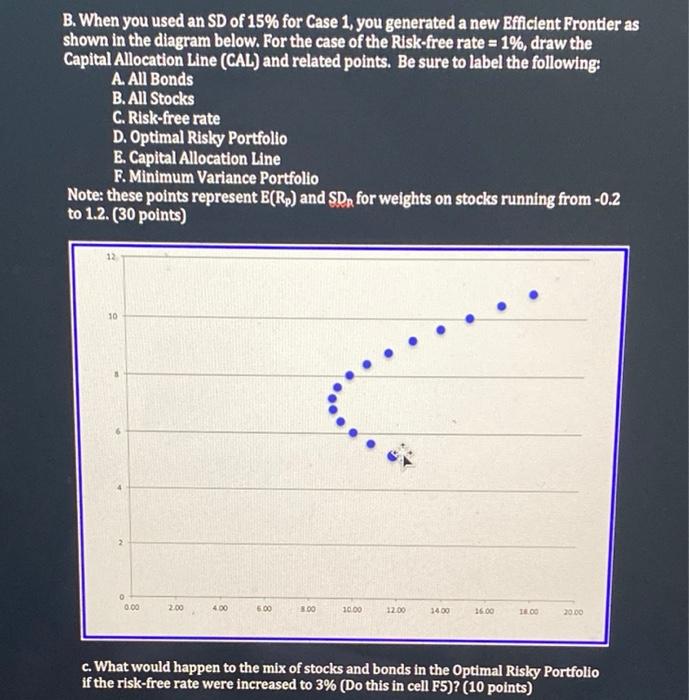
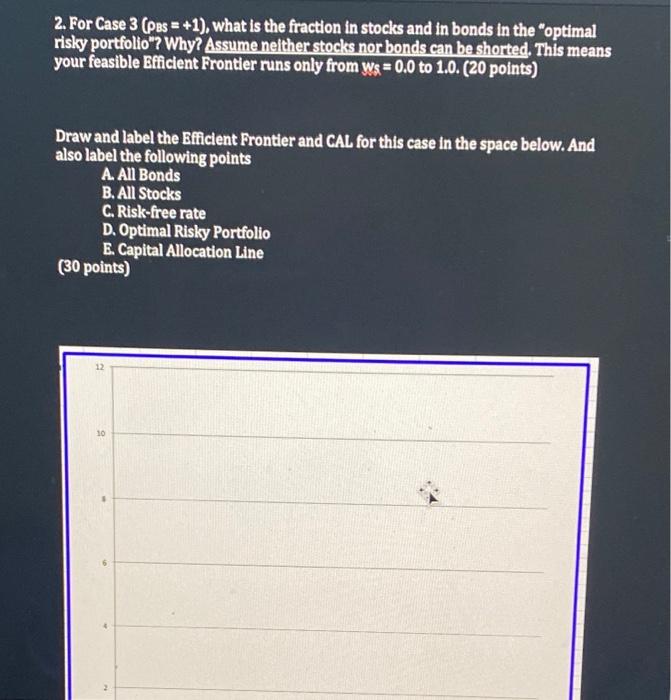
Group Members: Use the Excel spreadsheet and PPT slides to answer the following questions. 1. For Case 1, pos =+0.2, change the expected SD for stocks to 15\%. (Do this in Cell E37.) All other assumptions stay the same. a. In words, what was the effect of lowering the expected SD of stocks from 20% to 15% on the following? ( 10 points) The fraction of stocks in the optimal risky portfolio? The expected return of the optimal risky portfolio? The Sharpe Ratio of the optimal risky portfolio? B. When you used an SD of 15% for Case 1 , you generated a new Eficient Frontier as shown in the diagram below. For the case of the Risk-free rate =1%, draw the Capital Allocation Wine (CAL) and related points. Be sure to label the following: A. All Bonds B. All Stocks C. Risk-free rate D. Optimal Risky Portfolio E. Capital Allocation Line F. Minimum Variance Portfolio Note: these points represent E(Rp) and SDR for weights on stocks running from 0.2 to 1.2. ( 30 points) c. What would happen to the mix of stocks and bonds in the Optimal Risky Portfolio if the risk-free rate were increased to 3% (Do this in cell F5)? ( 10 points) 2. For Case 3( PBS =+1), what is the fraction in stocks and in bonds in the "optimal risky portfolio"? Why? Assume nelther stocks nor bonds can be shorted. This means your feasible Efficient Frontier runs only from Wg=0.0 to 1.0. (20 points) Draw and label the Efficient Frontier and CAL for this case in the space below. And also label the following points A. All Bonds B. All Stocks C. Risk-free rate D. Optimal Risky Portfolio E. Capital Allocation Line (30 points) Group Members: Use the Excel spreadsheet and PPT slides to answer the following questions. 1. For Case 1, pos =+0.2, change the expected SD for stocks to 15\%. (Do this in Cell E37.) All other assumptions stay the same. a. In words, what was the effect of lowering the expected SD of stocks from 20% to 15% on the following? ( 10 points) The fraction of stocks in the optimal risky portfolio? The expected return of the optimal risky portfolio? The Sharpe Ratio of the optimal risky portfolio? B. When you used an SD of 15% for Case 1 , you generated a new Eficient Frontier as shown in the diagram below. For the case of the Risk-free rate =1%, draw the Capital Allocation Wine (CAL) and related points. Be sure to label the following: A. All Bonds B. All Stocks C. Risk-free rate D. Optimal Risky Portfolio E. Capital Allocation Line F. Minimum Variance Portfolio Note: these points represent E(Rp) and SDR for weights on stocks running from 0.2 to 1.2. ( 30 points) c. What would happen to the mix of stocks and bonds in the Optimal Risky Portfolio if the risk-free rate were increased to 3% (Do this in cell F5)? ( 10 points) 2. For Case 3( PBS =+1), what is the fraction in stocks and in bonds in the "optimal risky portfolio"? Why? Assume nelther stocks nor bonds can be shorted. This means your feasible Efficient Frontier runs only from Wg=0.0 to 1.0. (20 points) Draw and label the Efficient Frontier and CAL for this case in the space below. And also label the following points A. All Bonds B. All Stocks C. Risk-free rate D. Optimal Risky Portfolio E. Capital Allocation Line (30 points)


