

Question
GUI Design Lab (Python!!!) Change this GUI design and complete the following tasks. the original code and the requirement of tasks are showing below. (Please
GUI Design Lab (Python!!!)
Change this GUI design and complete the following tasks.
the original code and the requirement of tasks are showing below. (Please use the original code as base)
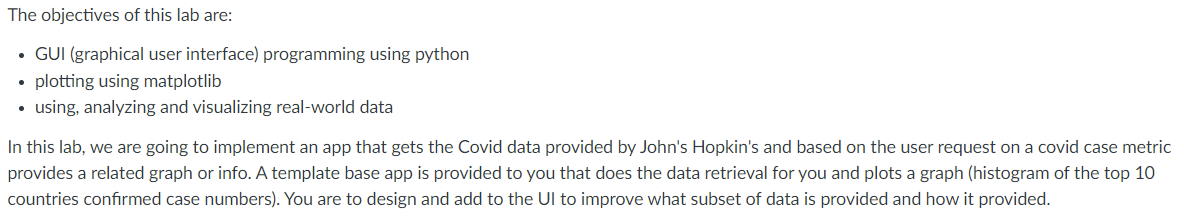
The objectives of this lab are:
- GUI (graphical user interface) programming using python
- plotting using matplotlib
- using, analyzing and visualizing real-world data
In this lab, we are going to implement an app that gets the Covid data provided by John's Hopkin's and based on the user request on a covid case metric provides a related graph or info. A template base app is provided to you that does the data retrieval for you and plots a graph (histogram of the top 10 countries confirmed case numbers). You are to design and add to the UI to improve what subset of data is provided and how it provided.
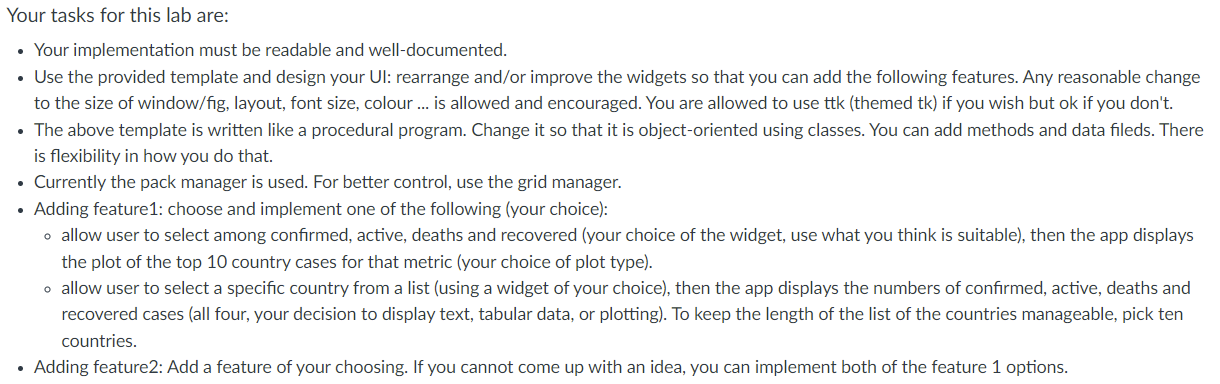
Your tasks for this lab are:
- Your implementation must be readable and well-documented.
- Use the provided template and design your UI: rearrange and/or improve the widgets so that you can add the following features. Any reasonable change to the size of window/fig, layout, font size, colour ... is allowed and encouraged. You are allowed to use ttk (themed tk) if you wish but ok if you don't.
- The above template is written like a procedural program. Change it so that it is object-oriented using classes. You can add methods and data fileds. There is flexibility in how you do that.
- Currently the pack manager is used. For better control, use the grid manager.
- Adding feature1: choose and implement one of the following (your choice):
- allow user to select among confirmed, active, deaths and recovered (your choice of the widget, use what you think is suitable), then the app displays the plot of the top 10 country cases for that metric (your choice of plot type).
- allow user to select a specific country from a list (using a widget of your choice), then the app displays the numbers of confirmed, active, deaths and recovered cases (all four, your decision to display text, tabular data, or plotting). To keep the length of the list of the countries manageable, pick ten countries.
- Adding feature2: Add a feature of your choosing. If you cannot come up with an idea, you can implement both of the feature 1 options.
The code are showing in text: (Please finish the tasks using Python, you can use Tkinter).
Thank you!
#covid simple dashboard app #imports from covid import Covid from tkinter import * import matplotlib matplotlib.use("TkAgg") from matplotlib.figure import Figure from matplotlib.backends.backend_tkagg import FigureCanvasTkAgg def getMasterCovidData() -> list: """ this function is called once to get the master data for this application; all data used in this application is derived from data returned by this function """ covid = Covid() #instantiate data = covid.get_data() return data def getConfirmed(data1: list) -> list: """ this function uses the masterdata data1 and returns a list of (country, confirmed) data """ confirmed = [] for i in data1: confirmed.append((i["country"], i["confirmed"])) #print("DEBUG: confirmed is ", confirmed) return confirmed def plotConfirmed(): """ a callback function for the button; plots a histogram of the top 10 confirmed cases """ global plotted, canvas if plotted: return fig = Figure(figsize = (8, 5)) plot1= fig.add_subplot(111) canvas = FigureCanvasTkAgg(fig, master = window) top10 = [confirmed[i] for i in range(10)] #print("DEBUG: top10", top10) x = [top10[i][0] for i in range(10)] y = [top10[i][1] for i in range(10)] plot1.bar(x, y) for tick in plot1.get_xticklabels(): #rotate the text slightly tick.set_rotation(15) canvas.draw() canvas.get_tk_widget().pack(fill=BOTH, expand=True) plotted = True def clear(): """ a callback for the Clear button """ global plotted, canvas if plotted: canvas.get_tk_widget().destroy() plotted = False #### program starts here #get masterData masterData = getMasterCovidData() #print("DEBUG: type(masterData) is", type(masterData)) confirmed = getConfirmed(masterData) #print("DEBUG: type(confirmed) is", type(confirmed)) #instantiate the main window window = Tk() window.geometry("800x500") window.title("Covid Data Visualization") plotted = False plot_button = Button(master = window, command = lambda: plotConfirmed(), height = 2, width = 15, text = "Plot: top 10 confirmed").pack() clear_button = Button(master = window, command = lambda: clear(), height = 2, width = 10, text = "Clear").pack() window.mainloop() The objectives of this lab are: GUI (graphical user interface) programming using python plotting using matplotlib using, analyzing and visualizing real-world data In this lab, we are going to implement an app that gets the Covid data provided by John's Hopkin's and based on the user request on a covid case metric provides a related graph or info. A template base app is provided to you that does the data retrieval for you and plots a graph (histogram of the top 10 countries confirmed case numbers). You are to design and add to the UI to improve what subset of data is provided and how it provided. Your tasks for this lab are: Your implementation must be readable and well-documented. Use the provided template and design your Ul: rearrange and/or improve the widgets so that you can add the following features. Any reasonable change to the size of window/fig, layout, font size, colour ... is allowed and encouraged. You are allowed to use ttk (themed tk) if you wish but ok if you don't. The above template is written like a procedural program. Change it so that it is object-oriented using classes. You can add methods and data fileds. There is flexibility in how you do that. Currently the pack manager is used. For better control, use the grid manager. Adding feature1: choose and implement one of the following your choice): o allow user to select among confirmed, active, deaths and recovered (your choice of the widget, use what you think is suitable), then the app displays the plot of the top 10 country cases for that metric (your choice of plot type). o allow user to select a specific country from a list (using a widget of your choice), then the app displays the numbers of confirmed, active, deaths and recovered cases (all four, your decision to display text, tabular data, or plotting). To keep the length of the list of the countries manageable, pick ten countries. Adding feature2: Add a feature of your choosing. If you cannot come up with an idea, you can implement both of the feature 1 options Step by Step Solution
There are 3 Steps involved in it
Step: 1

Get Instant Access to Expert-Tailored Solutions
See step-by-step solutions with expert insights and AI powered tools for academic success
Step: 2

Step: 3
Ace Your Homework with AI
Get the answers you need in no time with our AI-driven, step-by-step assistance
Get Started
Refactoring Databases Evolutionary Database Design
Authors: Scott Ambler, Pramod Sadalage
1st Edition
0321774515, 978-0321774514