Question
Gulliver Markets In early January 2019, Rini Das was going over the numbers one last time in preparation for a board of directors meeting at
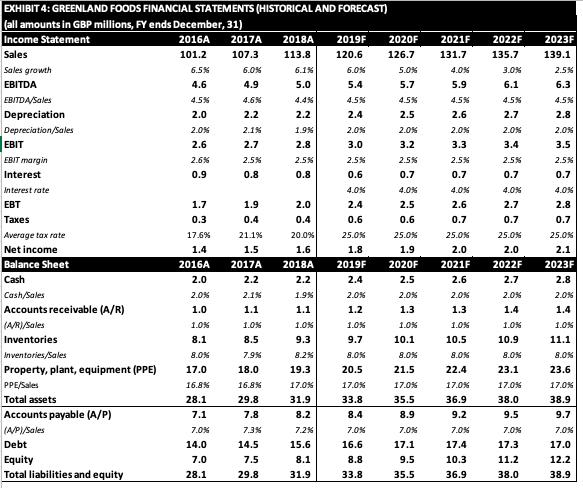
Gulliver Markets In early January 2019, Rini Das was going over the numbers one last time in preparation for a board of directors meeting at Gulliver Markets Ltd, the supermarket chain which she had been named CEO of only six months previously. Started in the eighties by two British entrepreneurs, Gulliver Markets had grown from a few stores specialized in canned foods into a large generalist supermarket chain with hundreds of stores in the UK, Ireland, and Scandinavia, where its market shares were small but non-negligible. To finance this expansion, the company had gone public on London's AIM stock exchange. The founders had gradually retired from daily management and promoted employees to leadership positions, including Rini. Yet both remained influential figures in the boardroom. Gulliver's impressive expansion had been based on organic growth but Rini thought inorganic growth was now necessary. She had identified Greenland Foods, a smaller chain specializing in frozen foods, including prepared meals and vegetables, as a potential target. The business was well-run but its founders and largest shareholders, nearing retirement and without a clear succession plan, were looking to cash out. They held 35% of the company's 5 million shares. Rini's team had met with them to discuss Greenland's state and business plans and she thought they would advise the other shareholders to accept an offer of GBP 4.20 per share from Gulliver. Greenland's latest stock price was GBP 3.26. Its shares had been trading for GBP 3.19 a week before, and for GBP 3.14 four weeks before. To conduct a valuation exercise, Rini's team had gathered information about Greenland. They had obtained financials for the last three years, and conducted some investigations of their own. On that basis, they had built projections for Greenland (Excel sheet 1), which included possible improvements and synergies an acquisition by Gulliver would bring about. 1 Greenland's leverage ratio (i.e., net-debt to enterprise value where enterprise value equals net debt plus market capitalization) was of 45%, its cost of debt of 4%. Its equity beta was 1.02 and its corporate tax rate was of 25%. The latest yield for long-term government bonds was of 2.6% and recent estimates of the market risk premium centered around 6%. The team had also put together data on Greenland's industry peers (Excel sheet 2) as well as on recent acquisitions of companies in the industry (Excel Sheet 3). NB: Target 5 was a private company, which is why its undisturbed stock price before its acquisition by Acquirer 5 was not available (N/A).
1) Estimate Greenland's value per-share as of January 1, 2019 based on DCF analysis with a forecast period of 2019-23: a. use a terminal value estimate based on a 2.5% perpetual growth rate and run a sensitivity analysis. b. use a terminal value estimate based on an EV/EBITDA multiple of 8.1x and run a sensitivity analysis.
2) Estimate Greenland's value per-share as of January 1, 2019 based on trading multiples: a. trailing (i.e., 2018), 1-year 5 (i.e., 2019) and 2-year forward (i.e., 2020) P/E ratios; b. trailing, 1-year and 2-year forward EV/EBITDA ratios.
3) Estimate Greenland's value per-share as of January 1, 2019 based on comparable transaction multiples.
4) Estimate Greenland's value per-share as of January 1, 2019 based on public takeover premia relative to the undisturbed stock price as of a. one day before the offer; b. one week before the offer; c. four weeks before the offer.
5) Given these estimates, do you recommend that Gulliver acquire Greenland at the price asked by its current owners?


EXHIBIT 4: GREENLAND FOODS FINANCIAL STATEMENTS (HISTORICAL AND FORECAST) (all amounts in GBP millions, FY ends December, 31) Income Statement 2016A 2017A 101.2 107.3 Sales Sales growth EBITDA EBITDA/Sales Depreciation Depreciation/Sales EBIT EBIT margin Interest Interest rate EBT Taxes Average tax rate Net income Balance Sheet Cash Cash/Sales Accounts receivable (A/R) (A/R)/Sales Inventories Inventories/Sales Property, plant, equipment (PPE) PPE/Sales Total assets Accounts payable (A/P) (A/P)/Sales Debt Equity Total liabilities and equity 6.5% 4.6 4.5% 2.0 2.0% 2.6 2.6% 0.9 1.7 0.3 17.6% 1.4 2016A 2.0 2.0% 1.0 1.0% 8.1 8.0% 17.0 16.8% 28.1 7.1 7.0% 14.0 7.0 28.1 6.0% 4.9 4.6% 2.2 2.1% 2.7 2.5% 0.8 1.9 0.4 21.1% 1.5 2017A 2.2 2.1% 1.1 1.0% 8.5 7.9% 18.0 16.8% 29.8 7.8 7.3% 14.5 7.5 29.8 2018A 113.8 6.1% 5.0 4.4% 2.2 1.9% 2.8 2.5% 0.8 2.0 0.4 20.0% 1.6 2018A 2.2 1.9% 1.1 1.0% 9.3 8.2% 19.3 17.0% 31.9 8.2 7.2% 15.6 8.1 31.9 2019F 120.6 6.0% 5.4 4.5% 2.4 2.0% 3.0 2.5% 0.6 4.0% 2.4 0.6 25.0% 1.8 2019F 2.4 2.0% 1.2 1.0% 9.7 8.0% 20.5 17.0% 33.8 8.4 7.0% 16.6 8.8 33.8 2020F 2021F 126.7 131.7 5.0% 5.7 4.5% 2.5 2.0% 3.2 2.5% 0.7 4.0% 2.5 0.6 25.0% 1.9 2020F 2.5 2.0% 1.3 1.0% 10.1 8.0% 21.5 17.0% 35.5 8.9 7.0% 17.1 9.5 35.5 4.0% 5.9 4.5% 2.6 2.0% 3.3 2.5% 0.7 4.0% 2.6 0.7 25.0% 2.0 2021F 2.6 2.0% 1.3 1.0% 10.5 8.0% 22.4 17.0% 36.9 9.2 7.0% 17.4 10.3 36.9 2022F 135.7 3.0% 6.1 4.5% 2.7 2.0% 3.4 2.5% 0.7 4.0% 2.7 0.7 25.0% 2.0 2022F 2.7 2.0% 1.4 1.0% 10.9 8.0% 23.1 17.0% 38.0 9.5 7.0% 17.3 11.2 38.0 2023F 139.1 2.5% 6.3 4.5% 2.8 2.0% 3.5 2.5% 0.7 4.0% 2.8 0.7 25.0% 2.1 2023F 2.8 2.0% 1.4 1.0% 11.1 8.0% 23.6 17.0% 38.9 9.7 7.0% 17.0 12.2 38.9
Step by Step Solution
3.52 Rating (159 Votes )
There are 3 Steps involved in it
Step: 1
1 Estimate Greenlands value pershare as of January 1 2019 based on DCF analysis with a forecast period of 201923 a use a terminal value estimate based on a 25 perpetual growth rate and run a sensitivi...
Get Instant Access to Expert-Tailored Solutions
See step-by-step solutions with expert insights and AI powered tools for academic success
Step: 2

Step: 3

Ace Your Homework with AI
Get the answers you need in no time with our AI-driven, step-by-step assistance
Get Started


