Answered step by step
Verified Expert Solution
Link Copied!

Question

1 Approved Answer

H K L M N O P Q Standard Mean Deviation Min 01 Median 03 Max Difference in scores: 105 0.4095238 5.0205256 -11 -3 4
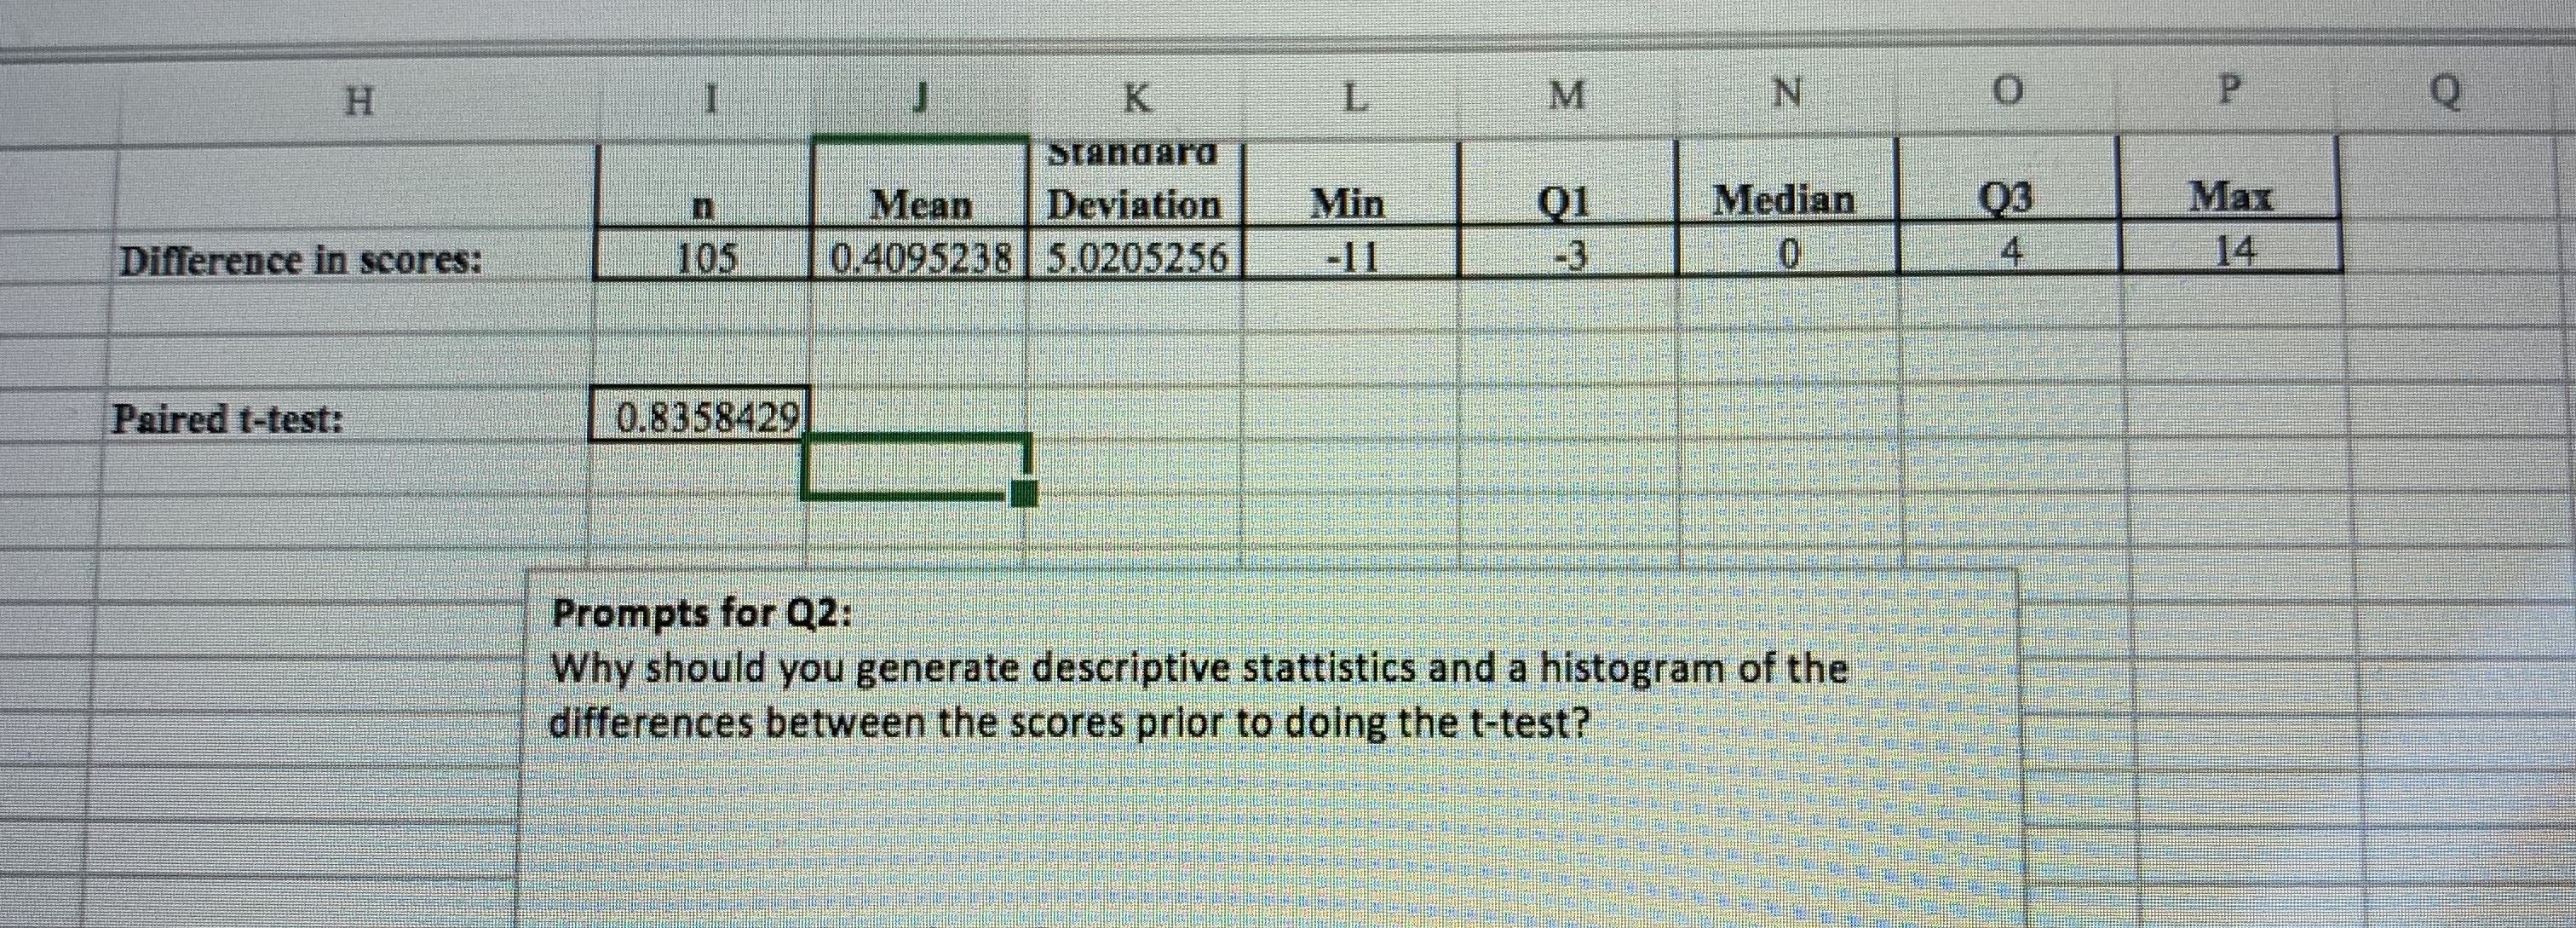
image text in transcribed
H K L M N O P Q Standard Mean Deviation Min 01 Median 03 Max Difference in scores: 105 0.4095238 5.0205256 -11 -3 4 14 Paired t-test: 0.8358429 Prompts for Q2: Why should you generate descriptive stattistics and a histogram of the differences between the scores prior to doing the t-test

Step by Step Solution

There are 3 Steps involved in it

Step: 1

blur-text-image

Get Instant Access to Expert-Tailored Solutions

See step-by-step solutions with expert insights and AI powered tools for academic success

Step: 2

blur-text-image_2

Step: 3

blur-text-image_3

Ace Your Homework with AI

Get the answers you need in no time with our AI-driven, step-by-step assistance

Get Started

Recommended Textbook for

Big Ideas Math A Common Core Curriculum Blue

Authors: Ron Larson, Laurie Boswell

1st Edition

1608402282, 978-1608402281

More Books

Students also viewed these Mathematics questions