Answered step by step
Verified Expert Solution
Question
1 Approved Answer
Harper, Inc., produces cell phone equipment. Tina Robertson, Harper's president, implemented a quality-improvement program that has now been in operation for 2 years. The

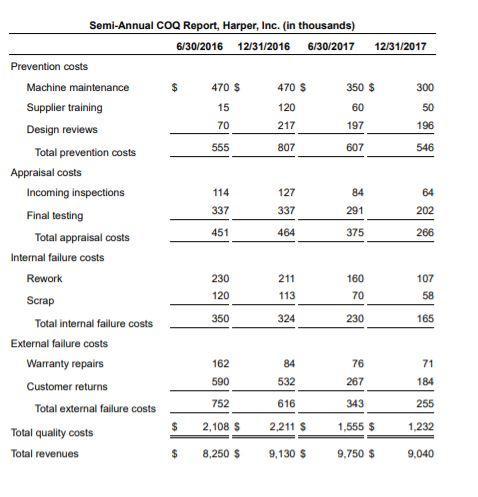
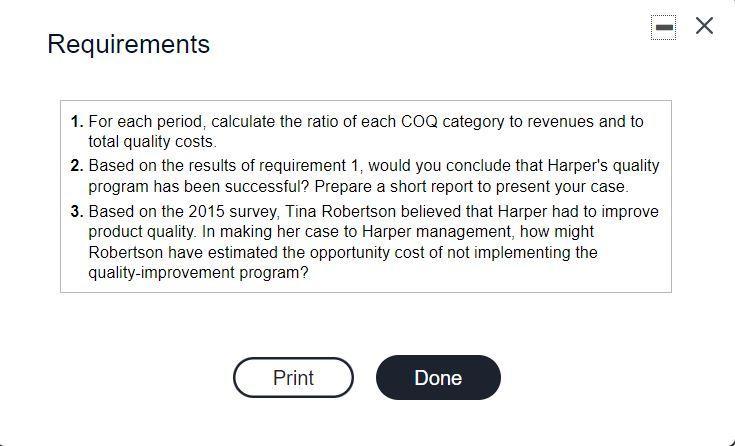
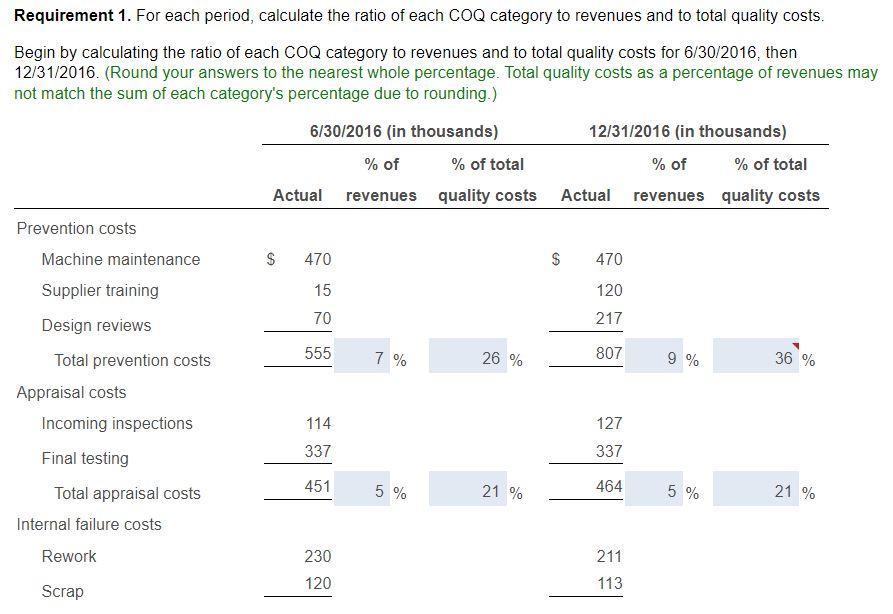

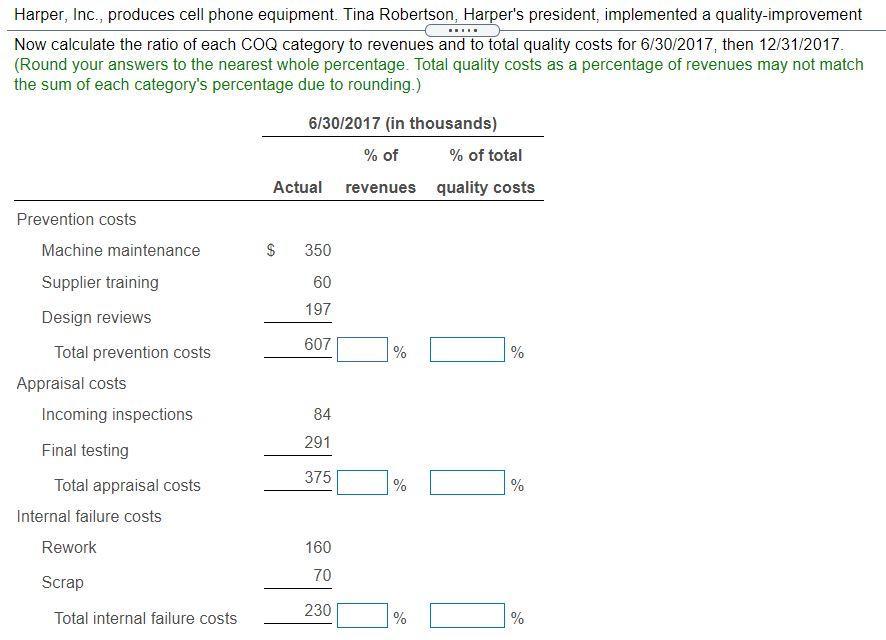

Harper, Inc., produces cell phone equipment. Tina Robertson, Harper's president, implemented a quality-improvement program that has now been in operation for 2 years. The cost report shown here has recently been issued. (Click the icon to view the cost report.) Read the requirements. ..... Prevention costs Semi-Annual COQ Report, Harper, Inc. (in thousands) 6/30/2016 12/31/2016 6/30/2017 Machine maintenance Supplier training Design reviews Total prevention costs Appraisal costs Incoming inspections Final testing Total appraisal costs Internal failure costs Rework Scrap Total internal failure costs External failure costs Warranty repairs Customer returns Total external failure costs Total quality costs Total revenues $ $ $ 470 $ 15 70 555 114 337 451 230 120 350 162 590 752 2,108 S 8,250 $ 470 $ 120 217 807 127 337 464 211 113 324 84 532 616 2,211 S 9,130 $ 350 $ 60 197 607 84 291 375 12/31/2017 160 70 230 76 267 343 1,555 $ 9,750 $ 300 50 196 546 64 202 266 107 58 165 71 184 255 1,232 9,040 Requirements 1. For each period, calculate the ratio of each COQ category to revenues and to total quality costs. 2. Based on the results of requirement 1, would you conclude that Harper's quality program has been successful? Prepare a short report to present your case. 3. Based on the 2015 survey, Tina Robertson believed that Harper had to improve product quality. In making her case to Harper management, how might Robertson have estimated the opportunity cost of not implementing the quality-improvement program? Print Done X Requirement 1. For each period, calculate the ratio of each COQ category to revenues and to total quality costs. Begin by calculating the ratio of each COQ category to revenues and to total quality costs for 6/30/2016, then 12/31/2016. (Round your answers to the nearest whole percentage. Total quality costs as a percentage of revenues may not match the sum of each category's percentage due to rounding.) Prevention costs Machine maintenance Supplier training Design reviews Total prevention costs Appraisal costs Incoming inspections Final testing Total appraisal costs Internal failure costs Rework Scrap 6/30/2016 (in thousands) % of revenues Actual S 470 15 70 555 114 337 451 230 120 7% 5% % of total quality costs 26 % 21 % 12/31/2016 (in thousands) % of Actual revenues $ 470 120 217 807 127 337 464 211 113 9% 5 % % of total quality costs 36 % 21 % Scrap Total internal failure costs External failure costs Warranty repairs Customer returns Total external failure costs Total quality costs Total revenues 350 162 590 752 $ 2,108 $ 8,250 4% 9% 25 % 17% 36 % $ $ 324 84 532 616 2,211 9,130 4% 7% 24 % 15 % 28 % ww*** Harper, Inc., produces cell phone equipment. Tina Robertson, Harper's president, implemented a quality-improvement Now calculate the ratio of each COQ category to revenues and to total quality costs for 6/30/2017, then 12/31/2017. (Round your answers to the nearest whole percentage. Total quality costs as a percentage of revenues may not match the sum of each category's percentage due to rounding.) Prevention costs Machine maintenance Supplier training Design reviews Total prevention costs Appraisal costs Incoming inspections Final testing Total appraisal costs Internal failure costs Rework Scrap Total internal failure costs 6/30/2017 (in thousands) % of revenues Actual $ 350 60 197 607 84 291 375 160 70 230 % % % % of total quality costs % % % External failure costs Warranty repairs Customer returns Total external failure costs Total quality costs Total revenues $ $ 76 267 343 1,555 9,750 % % %
Step by Step Solution
★★★★★
3.43 Rating (153 Votes )
There are 3 Steps involved in it
Step: 1
6302017 Prevention casts Machine maintenance Supplier training Design review Total preventio...
Get Instant Access to Expert-Tailored Solutions
See step-by-step solutions with expert insights and AI powered tools for academic success
Step: 2

Step: 3

Ace Your Homework with AI
Get the answers you need in no time with our AI-driven, step-by-step assistance
Get Started


