

Answered step by step
Verified Expert Solution
Question
1 Approved Answer
Harris Pine Mills Company is the nation's largest manufacturer of softwood furniture. National distribution is achieved through a network of fifteen branch assembly plants scattered
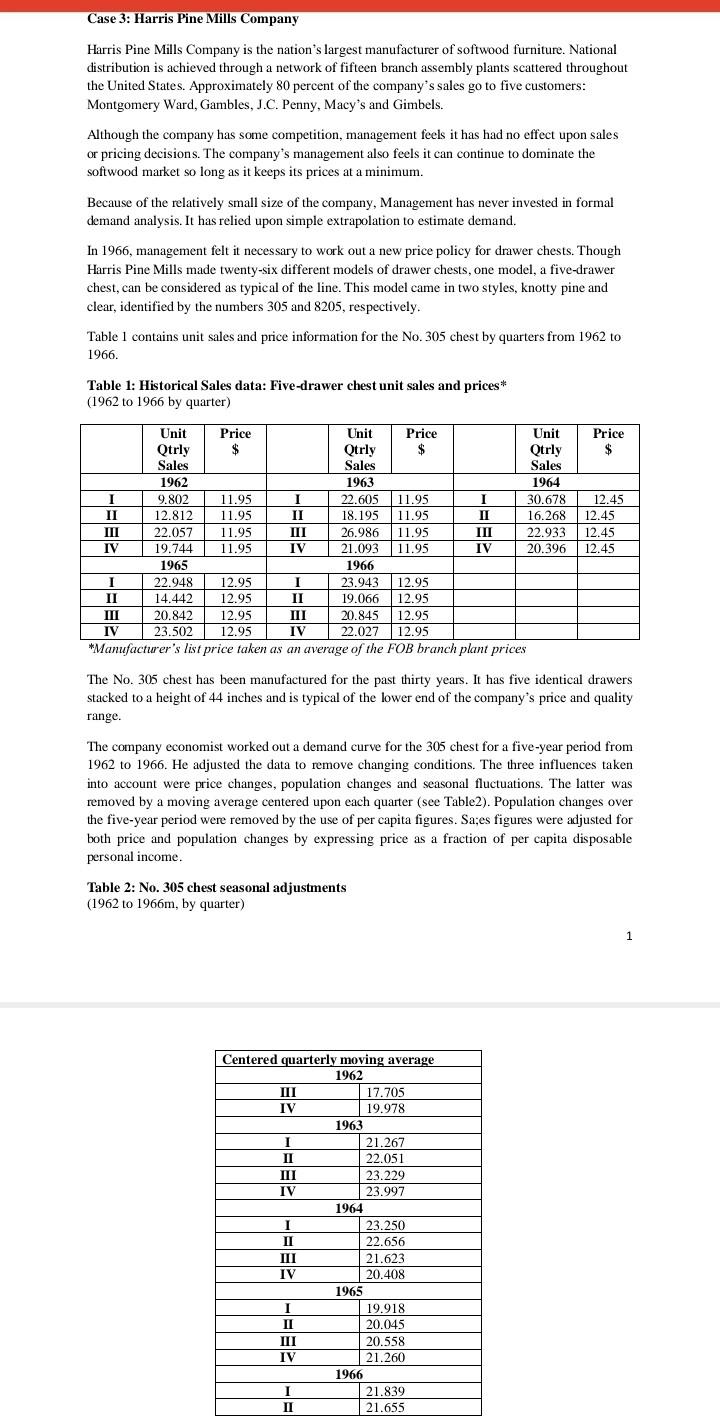
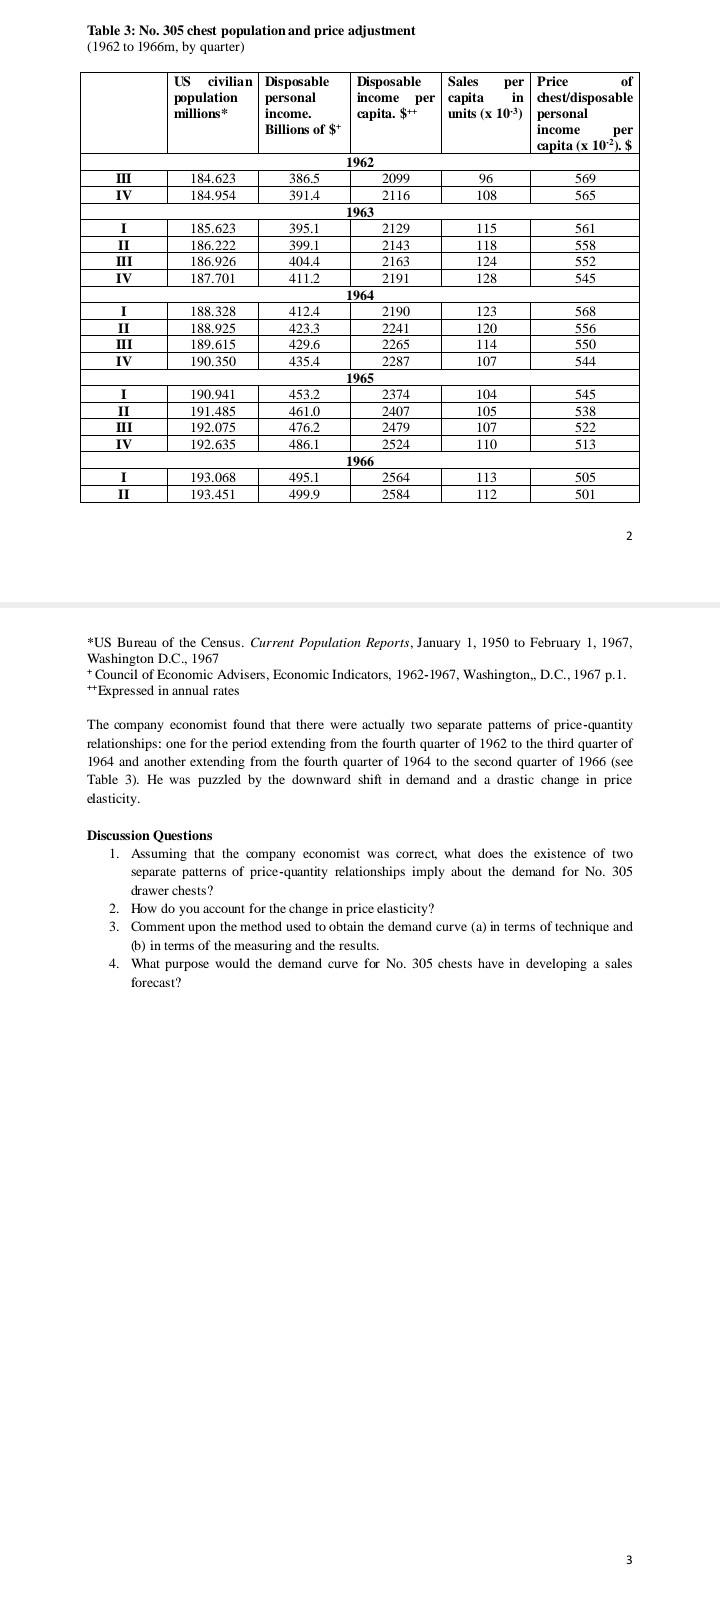
Harris Pine Mills Company is the nation's largest manufacturer of softwood furniture. National distribution is achieved through a network of fifteen branch assembly plants scattered throughout the United States. Approximately 80 percent of the company's sales go to five customers: Montgomery Ward, Gambles, J.C. Penny, Macy's and Gimbels. Although the company has some competition, management feels it has had no effect upon sales or pricing decisions. The company's management also feels it can continue to dominate the softwood market so long as it keeps its prices at a minimum. Because of the relatively small size of the company, Management has never invested in formal demand analysis. It has relied upon simple extrapolation to estimate demand. In 1966, management felt it necessary to work out a new price policy for drawer chests. Though Harris Pine Mills made twenty-six different models of drawer chests, one model, a five-drawer chest, can be considered as typical of the line. This model came in two styles, knotty pine and clear, identified by the numbers 305 and 8205 , respectively. Table 1 contains unit sales and price information for the No. 305 chest by quarters from 1962 to 1966. Table 1: Historical Sales data: Five-drawer chest unit sales and prices* (1962 to 1966 by quarter) The No. 305 chest has been manufactured for the past thirty years. It has five identical drawers stacked to a height of 44 inches and is typical of the lower end of the company's price and quality range. The company economist worked out a demand curve for the 305 chest for a five-year period from 1962 to 1966 . He adjusted the data to remove changing conditions. The three influences taken into account were price changes, population changes and seasonal fluctuations. The latter was removed by a moving average centered upon each quarter (see Table2). Population changes over the five-year period were removed by the use of per capita figures. Sa;es figures were adjusted for both price and population changes by expressing price as a fraction of per capita disposable personal income. Table 2: No. 305 chest seasonal adjustments (1962 to 1966m, by quarter) Table 3: No. 305 chest population and price adjustment (1962 to 1966m, by quarter) *US Bureau of the Census. Current Population Reports, January 1, 1950 to February 1, 1967, Washington D.C., 1967 + Council of Economic Advisers, Economic Indicators, 1962-1967, Washington,, D.C., 1967 p.1. +Expressed in annual rates The company economist found that there were actually two separate pattems of price-quantity relationships: one for the period extending from the fourth quarter of 1962 to the third quarter of 1964 and another extending from the fourth quarter of 1964 to the second quarter of 1966 (see Table 3). He was puzzled by the downward shift in demand and a drastic change in price elasticity. Discussion Questions 1. Assuming that the company economist was correct, what does the existence of two separate patterns of price-quantity relationships imply about the demand for No. 305 drawer chests? 2. How do you account for the change in price elasticity? 3. Comment upon the method used to obtain the demand curve (a) in terms of technique and (b) in terms of the measuring and the results. 4. What purpose would the demand curve for No. 305 chests have in developing a sales forecast? Harris Pine Mills Company is the nation's largest manufacturer of softwood furniture. National distribution is achieved through a network of fifteen branch assembly plants scattered throughout the United States. Approximately 80 percent of the company's sales go to five customers: Montgomery Ward, Gambles, J.C. Penny, Macy's and Gimbels. Although the company has some competition, management feels it has had no effect upon sales or pricing decisions. The company's management also feels it can continue to dominate the softwood market so long as it keeps its prices at a minimum. Because of the relatively small size of the company, Management has never invested in formal demand analysis. It has relied upon simple extrapolation to estimate demand. In 1966, management felt it necessary to work out a new price policy for drawer chests. Though Harris Pine Mills made twenty-six different models of drawer chests, one model, a five-drawer chest, can be considered as typical of the line. This model came in two styles, knotty pine and clear, identified by the numbers 305 and 8205 , respectively. Table 1 contains unit sales and price information for the No. 305 chest by quarters from 1962 to 1966. Table 1: Historical Sales data: Five-drawer chest unit sales and prices* (1962 to 1966 by quarter) The No. 305 chest has been manufactured for the past thirty years. It has five identical drawers stacked to a height of 44 inches and is typical of the lower end of the company's price and quality range. The company economist worked out a demand curve for the 305 chest for a five-year period from 1962 to 1966 . He adjusted the data to remove changing conditions. The three influences taken into account were price changes, population changes and seasonal fluctuations. The latter was removed by a moving average centered upon each quarter (see Table2). Population changes over the five-year period were removed by the use of per capita figures. Sa;es figures were adjusted for both price and population changes by expressing price as a fraction of per capita disposable personal income. Table 2: No. 305 chest seasonal adjustments (1962 to 1966m, by quarter) Table 3: No. 305 chest population and price adjustment (1962 to 1966m, by quarter) *US Bureau of the Census. Current Population Reports, January 1, 1950 to February 1, 1967, Washington D.C., 1967 + Council of Economic Advisers, Economic Indicators, 1962-1967, Washington,, D.C., 1967 p.1. +Expressed in annual rates The company economist found that there were actually two separate pattems of price-quantity relationships: one for the period extending from the fourth quarter of 1962 to the third quarter of 1964 and another extending from the fourth quarter of 1964 to the second quarter of 1966 (see Table 3). He was puzzled by the downward shift in demand and a drastic change in price elasticity. Discussion Questions 1. Assuming that the company economist was correct, what does the existence of two separate patterns of price-quantity relationships imply about the demand for No. 305 drawer chests? 2. How do you account for the change in price elasticity? 3. Comment upon the method used to obtain the demand curve (a) in terms of technique and (b) in terms of the measuring and the results. 4. What purpose would the demand curve for No. 305 chests have in developing a sales forecast
Step by Step Solution
There are 3 Steps involved in it
Step: 1

Get Instant Access to Expert-Tailored Solutions
See step-by-step solutions with expert insights and AI powered tools for academic success
Step: 2

Step: 3
Ace Your Homework with AI
Get the answers you need in no time with our AI-driven, step-by-step assistance
Get Started
Personal Trainer 3 0 Online For Albright/Ingram/Hills Managerial Accounting Information For Decisions
Authors: Thomas L. Albright, Robert W. Ingram, John S. Hill
4th Edition
0324233388, 978-0324233384