Answered step by step
Verified Expert Solution
Question
1 Approved Answer
having shown the practice piece partially solved, please answer the following in the last picture provided below. Will give a thumbs up, thank you and
having shown the practice piece partially solved, please answer the following in the last picture provided below. Will give a thumbs up, thank you and God bless what you do. 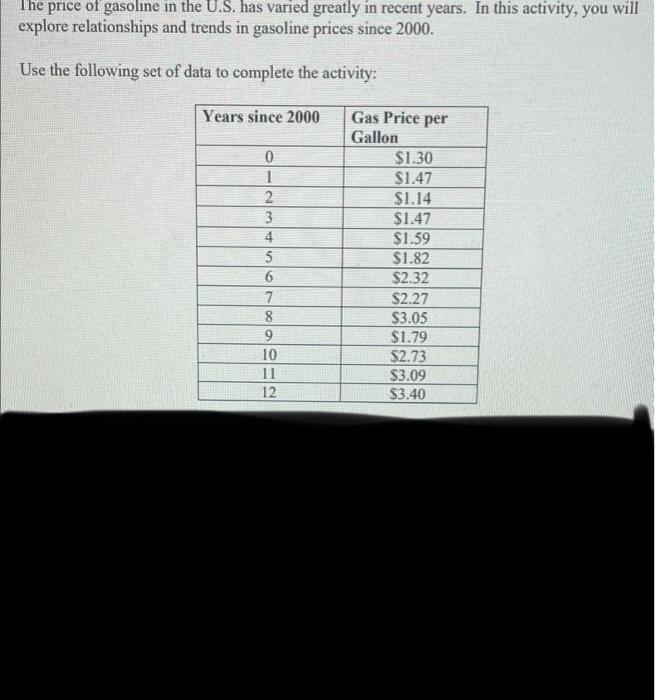
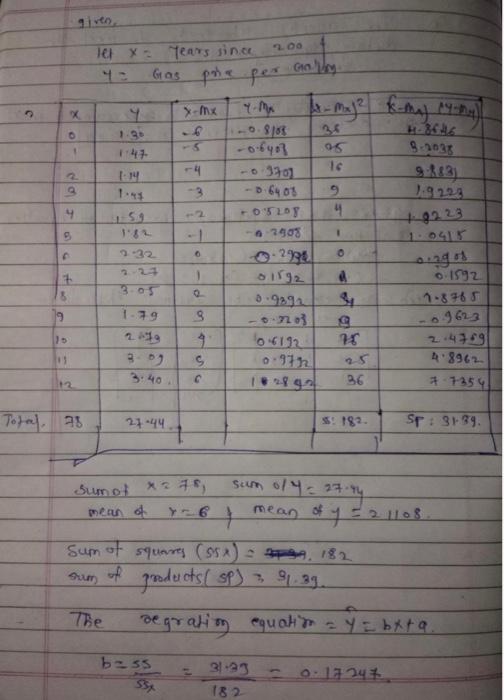
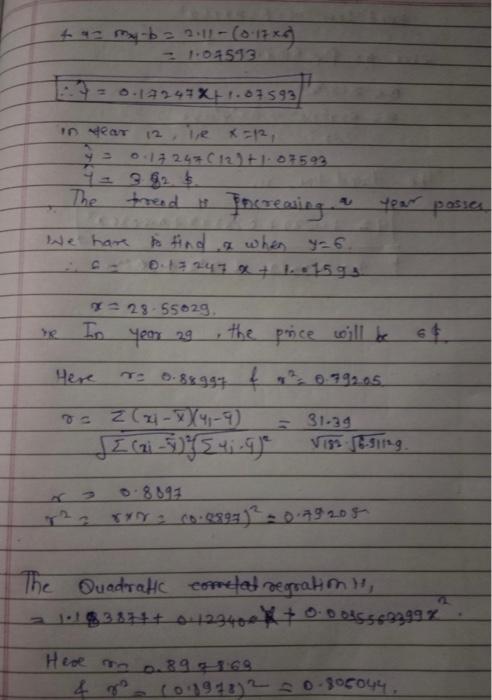
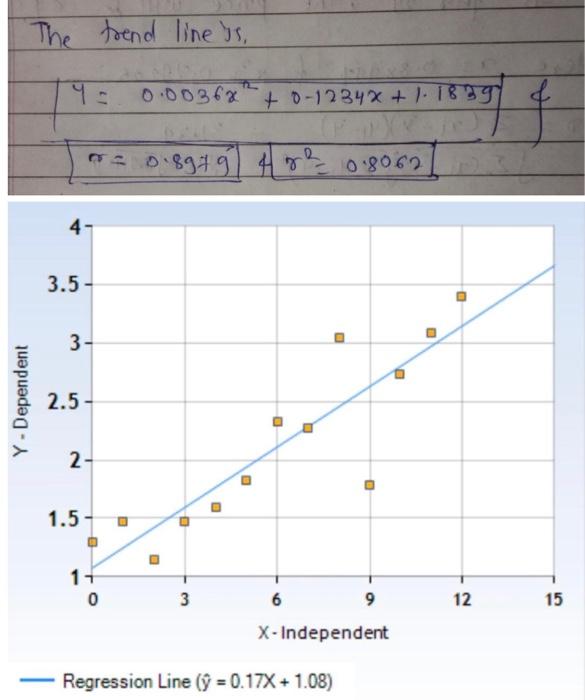
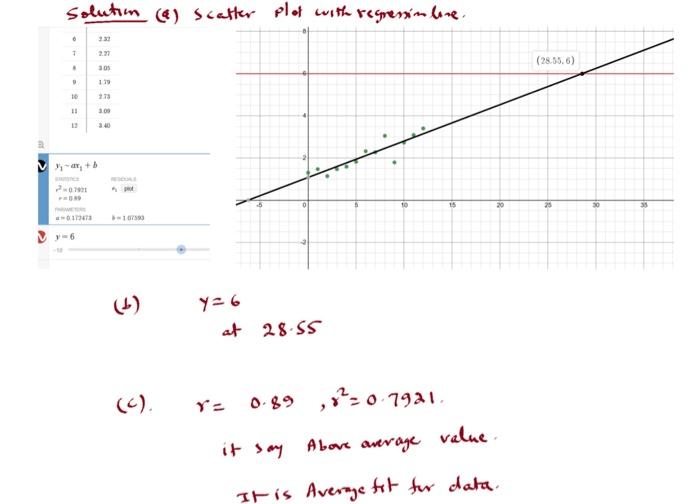
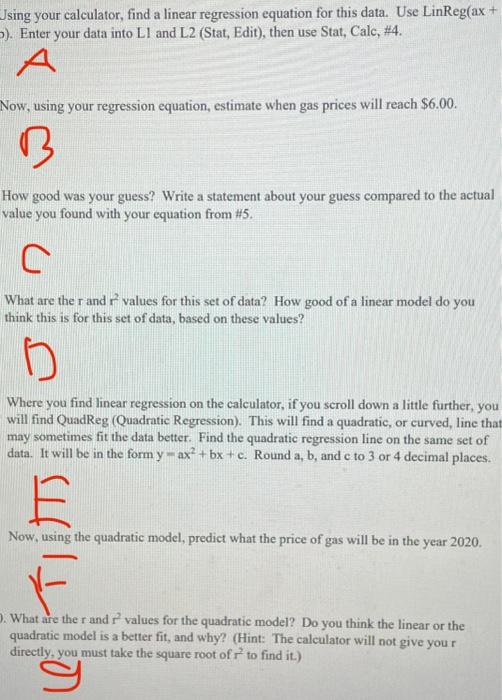
The price of gasoline in the U.S. has varied greatly in recent years. In this activity, you will explore relationships and trends in gasoline prices since 2000. Use the following set of data to complete the activity: Years since 2000 0 1 2 3 4 5 6 7 8 9 10 11 12 Gas Price per Gallon $1.30 $1.47 $1.14 $1.47 $1.59 $1.82 $2.32 $2.27 $3.05 $1.79 $2.73 $3.09 $3.40 X 0 O 9 EP 1.45 9 let x = years since Gas pra per Gallery 4 x-mx - maja km - Mahal 1.38 6 35 5 95 9:2035 -4 - 3701 16 9:13) -3 -0.6408 9 1.9229 50 05205 4 +9222 382 -7908 15 0-22 0.13 1 sirg2 4 o 1992 1.8765 1.79 9 -0.7o 9 9623 9 16.6192 10 2.4709 S 0.972 4.8962 36 7 7354 1 0 o 305 1 5 19 0.9292 3:52 3.40 1921 To al. 23 21-44 $ 182. Sp: 3139. Sumot *270, mean of sum ol4= 27.ry mean off - 2 110 Sum of squares (55x) = 0, 182 products Sp) 39:39 The Begration equation ay = bxta. Sum of b=ss 532 31-23 182 ola 24 to my b2 2.11 - (0-1720) 102593 AT ..14247X+1.61593 Dear 12 te K512, O 124 125 +1.07592 your posie The treed Theresing We have to and a when y=6. 243 1.61593 29-55629 In year 29 the price will be 64 Here TD-88991 0.799.05. = 31.39 os z(x-xX4-4) I Cai - 45 4; .ge Viss ing 0.8893 72, 00-0899) 2049 205 The Quadraft come ad regration, 1.163.874 + 0-123400X + 0.0 BiS560399 7 Here To 0.896 410191332 30-390044. " The trend line us, 0.00362 to-12 34x+1.1839 0-1234* + 0 = 0.89191 4 0.8062 4 3.5- 3- Y- Dependent 2.5 2- 1.5 . 17 0 3 12 15 6 9 X - Independent Regression Line ( = 0.17X+1.08) solution (&) Scatter plot with regresinbre. . + 2.22 (28.65.6) 30 179 . 10 11 3.00 30 2011 TO 15 20 25 30 35 13 167593 6 (1) Y26 at 28.55 (0) 0.89 , 0220 7921 it say Above average value It is Average fit for data Jsing your calculator, find a linear regression equation for this data. Use LinReg(ax + -). Enter your data into LI and L2 (Stat, Edit), then use Stat, Calc, #4. A Now, using your regression equation, estimate when gas prices will reach $6.00. B How good was your guess? Write a statement about your guess compared to the actual value you found with your equation from #5. What are the rand values for this set of data? How good of a linear model do you think this is for this set of data, based on these values? Where you find linear regression on the calculator, if you scroll down a little further, you will find QuadReg (Quadratic Regression). This will find a quadratic, or curved, line that may sometimes fit the data better. Find the quadratic regression line on the same set of data. It will be in the form y-ax? + bx+c. Round a, b, and c to 3 or 4 decimal places. E Now, using the quadratic model, predict what the price of gas will be in the year 2020 . What are the rand values for the quadratic model? Do you think the linear or the quadratic model is a better fit, and why? (Hint: The calculator will not give your directly, you must take the square root of r to find it.) le The price of gasoline in the U.S. has varied greatly in recent years. In this activity, you will explore relationships and trends in gasoline prices since 2000. Use the following set of data to complete the activity: Years since 2000 0 1 2 3 4 5 6 7 8 9 10 11 12 Gas Price per Gallon $1.30 $1.47 $1.14 $1.47 $1.59 $1.82 $2.32 $2.27 $3.05 $1.79 $2.73 $3.09 $3.40 X 0 O 9 EP 1.45 9 let x = years since Gas pra per Gallery 4 x-mx - maja km - Mahal 1.38 6 35 5 95 9:2035 -4 - 3701 16 9:13) -3 -0.6408 9 1.9229 50 05205 4 +9222 382 -7908 15 0-22 0.13 1 sirg2 4 o 1992 1.8765 1.79 9 -0.7o 9 9623 9 16.6192 10 2.4709 S 0.972 4.8962 36 7 7354 1 0 o 305 1 5 19 0.9292 3:52 3.40 1921 To al. 23 21-44 $ 182. Sp: 3139. Sumot *270, mean of sum ol4= 27.ry mean off - 2 110 Sum of squares (55x) = 0, 182 products Sp) 39:39 The Begration equation ay = bxta. Sum of b=ss 532 31-23 182 ola 24 to my b2 2.11 - (0-1720) 102593 AT ..14247X+1.61593 Dear 12 te K512, O 124 125 +1.07592 your posie The treed Theresing We have to and a when y=6. 243 1.61593 29-55629 In year 29 the price will be 64 Here TD-88991 0.799.05. = 31.39 os z(x-xX4-4) I Cai - 45 4; .ge Viss ing 0.8893 72, 00-0899) 2049 205 The Quadraft come ad regration, 1.163.874 + 0-123400X + 0.0 BiS560399 7 Here To 0.896 410191332 30-390044. " The trend line us, 0.00362 to-12 34x+1.1839 0-1234* + 0 = 0.89191 4 0.8062 4 3.5- 3- Y- Dependent 2.5 2- 1.5 . 17 0 3 12 15 6 9 X - Independent Regression Line ( = 0.17X+1.08) solution (&) Scatter plot with regresinbre. . + 2.22 (28.65.6) 30 179 . 10 11 3.00 30 2011 TO 15 20 25 30 35 13 167593 6 (1) Y26 at 28.55 (0) 0.89 , 0220 7921 it say Above average value It is Average fit for data Jsing your calculator, find a linear regression equation for this data. Use LinReg(ax + -). Enter your data into LI and L2 (Stat, Edit), then use Stat, Calc, #4. A Now, using your regression equation, estimate when gas prices will reach $6.00. B How good was your guess? Write a statement about your guess compared to the actual value you found with your equation from #5. What are the rand values for this set of data? How good of a linear model do you think this is for this set of data, based on these values? Where you find linear regression on the calculator, if you scroll down a little further, you will find QuadReg (Quadratic Regression). This will find a quadratic, or curved, line that may sometimes fit the data better. Find the quadratic regression line on the same set of data. It will be in the form y-ax? + bx+c. Round a, b, and c to 3 or 4 decimal places. E Now, using the quadratic model, predict what the price of gas will be in the year 2020 . What are the rand values for the quadratic model? Do you think the linear or the quadratic model is a better fit, and why? (Hint: The calculator will not give your directly, you must take the square root of r to find it.) le 


Step by Step Solution
There are 3 Steps involved in it
Step: 1

Get Instant Access to Expert-Tailored Solutions
See step-by-step solutions with expert insights and AI powered tools for academic success
Step: 2

Step: 3

Ace Your Homework with AI
Get the answers you need in no time with our AI-driven, step-by-step assistance
Get Started


