HD.....HELLO TUTORS PLEASE HELP ME IN THE FOLLOWING QUESTIONS
1. Find the P-value for the indicated hypothesis test with the given standardized test statistic, z. Decide whether to rejectH0for the given level of significance.
Two-tailed test with test statistic z= -1.94 and= 0.07.
P-value = ?
2. Find the P-value for the indicated hypothesis test with the given standardized test statistic, z. Decide whether to reject H0for the given level of significance. Right-tailed test with test statistic z=1.74 and= 0.02.
P-value =?
3. Find the critical z values. Assume that the normal distribution applies.
Right-tailed test;= 0.01
z=?
4. Find the critical z values. Assume that the normal distribution applies.
Two-tailed test;= 0.06
z=?
2
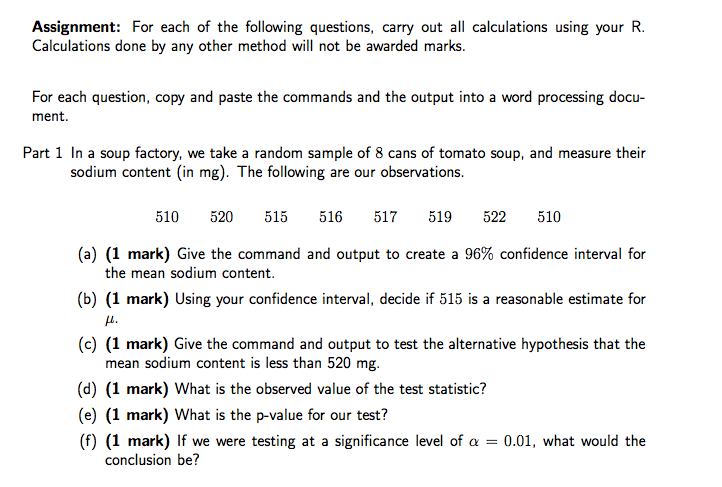
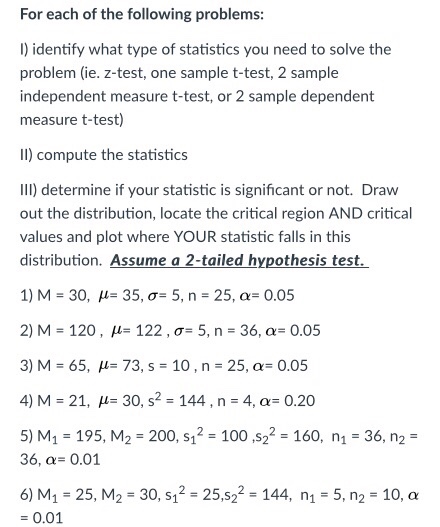
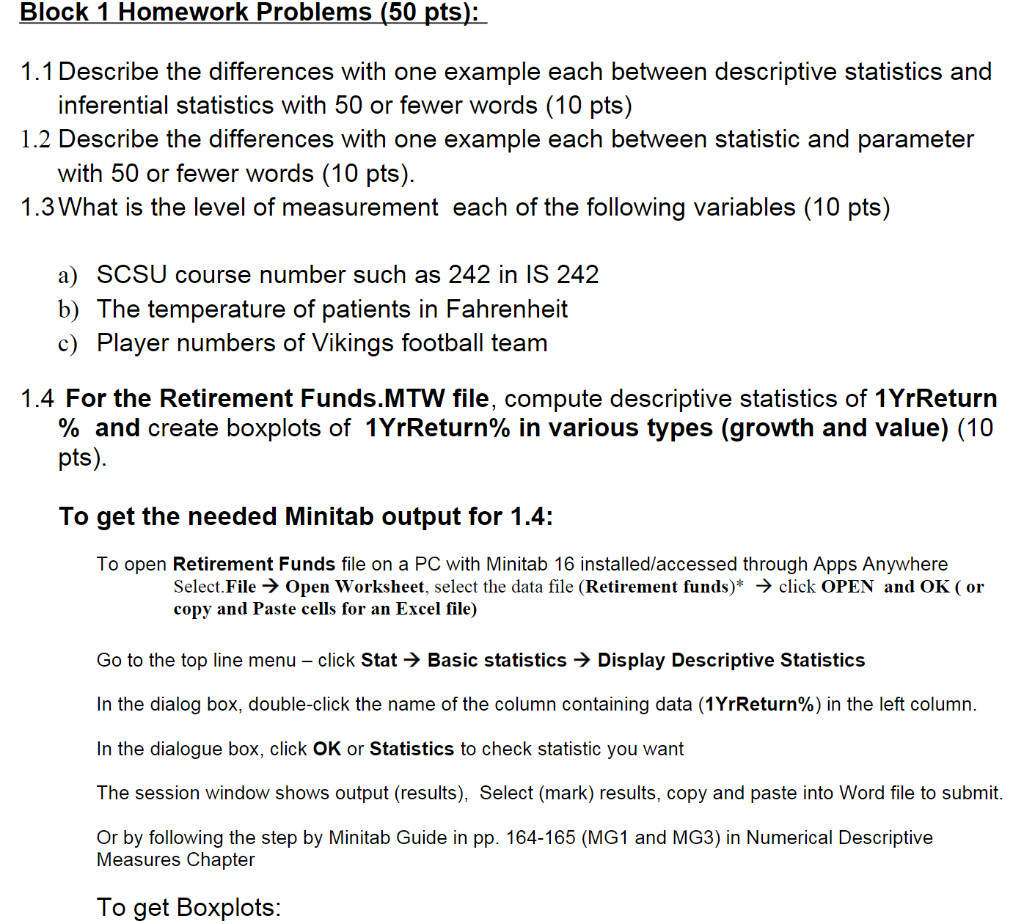
Assignment: For each of the following questions, carry out all calculations using your R. Calculations done by any other method will not be awarded marks. For each question, copy and paste the commands and the output into a word processing docu- ment. Part 1 In a soup factory, we take a random sample of 8 cans of tomato soup, and measure their sodium content (in mg). The following are our observations. 510 520 515 516 517 519 522 510 (a) (1 mark) Give the command and output to create a 96% confidence interval for the mean sodium content. (b) (1 mark) Using your confidence interval, decide if 515 is a reasonable estimate for (c) (1 mark) Give the command and output to test the alternative hypothesis that the mean sodium content is less than 520 mg (d) (1 mark) What is the observed value of the test statistic? (e) (1 mark) What is the p-value for our test? (f) (1 mark) If we were testing at a significance level of o = 0.01, what would the conclusion be?For each of the following problems: I) identify what type of statistics you need to solve the problem (ie. z-test, one sample t-test, 2 sample independent measure t-test, or 2 sample dependent measure t-test) Il) compute the statistics Ill) determine if your statistic is significant or not. Draw out the distribution, locate the critical region AND critical values and plot where YOUR statistic falls in this distribution. Assume a 2-tailed hypothesis test. 1) M = 30, /= 35, 0= 5, n = 25, or= 0.05 2) M = 120, /= 122 , 0= 5, n = 36, a= 0.05 3) M = 65, /= 73, s = 10, n = 25, a= 0.05 4) M = 21, /= 30, s2 = 144 , n = 4, a= 0.20 5) M1 = 195, M2 = 200, s12 = 100 ,s22 = 160, n1 = 36, n2 = 36, a= 0.01 6) M1 = 25, M2 = 30, s12 = 25,522 = 144, nj = 5, n2 = 10, ox = 0.01Block 1 Homework Problems (50 pts): 1.1 Describe the differences with one example each between descriptive statistics and inferential statistics with 50 or fewer words (10 pts) 1.2 Describe the differences with one example each between statistic and parameter with 50 or fewer words (10 pts). 1.3What is the level of measurement each of the following variables (1 0 pts) 3) SCSU course number such as 242 in IS 242 b) The temperature of patients in Fahrenheit c) Player numbers of Vikings football team 1.4 For the Retirement FundsMTW file, compute descriptive statistics of 1YrReturn % and create boxplots of 1YrReturn% in various types (growth and value) (10 pts). To get the needed Minitab output for 1.4: To open Retirement Funds le on a PC with Minitab 16 installediaccessed through Apps Anywhere Select.File -) Open Worksheet, select the data le (Retirement funds)' -) click OPEN and 0K ( or copy and Paste cells for an Excel le) Go to the top line menu click Stat -) Basic statistics -) Display Descriptive Statistics In the dialog box, doubleclick the name of the column containing data (1 YrReturn'Vo) in the left column. In the dialogue box, click OK or Statistics to check statistic you want The session window shows output (results), Select (mark) results. copy and paste into Word le to submit. Or by following the step by Minitab Guide in pp; 164-165 (M61 and M63) in Numerical Descriptive Measures Chapter To get Boxplots