Answered step by step
Verified Expert Solution
Question
1 Approved Answer
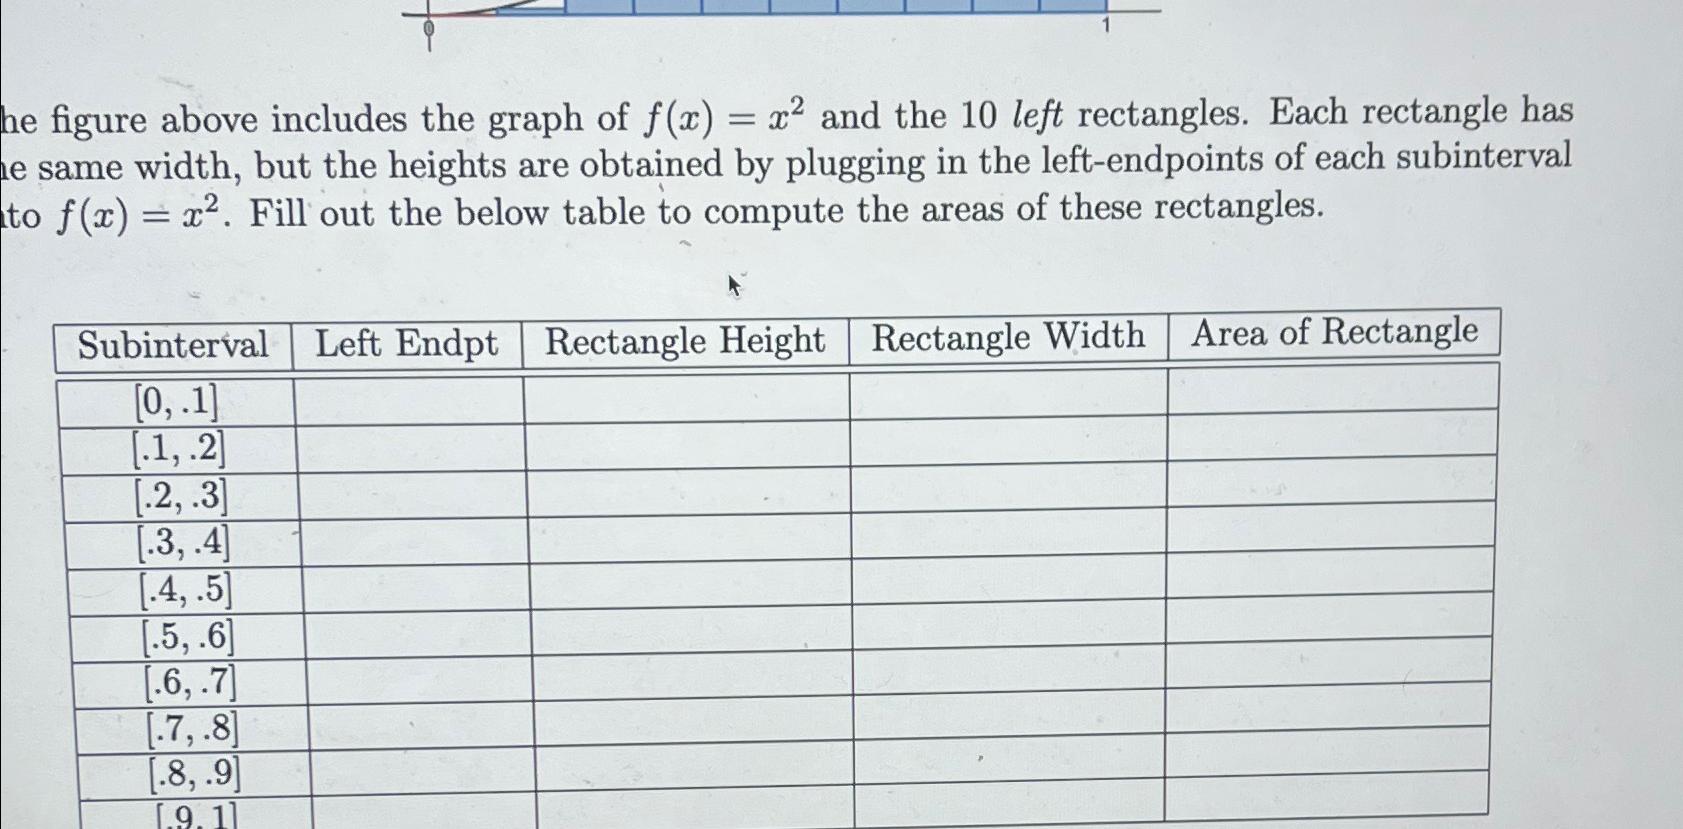
he figure above includes the graph of f(x)=x^(2) and the 10 left rectangles. Each rectangle has e same width, but the heights are obtained by
he figure above includes the graph of
f(x)=x^(2)and the 10 left rectangles. Each rectangle has e same width, but the heights are obtained by plugging in the left-endpoints of each subinterval to
f(x)=x^(2). Fill out the below table to compute the areas of these rectangles.\ \\\\table[[Subinterval,Left Endpt,Rectangle Height,Rectangle Width,Area of Rectangle],[
0,.1,,,,],[
.1,.2,,,,],[
.2,.3,,,,],[
.3,.4,,,,],[
.4,.5,,,,],[
.5,.6,,,,],[
.6,.7,,,,],[
.7,.8,,,,],[
.8,.9,,,,],[
9.1,,,,]]

Step by Step Solution
There are 3 Steps involved in it
Step: 1

Get Instant Access to Expert-Tailored Solutions
See step-by-step solutions with expert insights and AI powered tools for academic success
Step: 2

Step: 3

Ace Your Homework with AI
Get the answers you need in no time with our AI-driven, step-by-step assistance
Get Started


