

Question
he following table shows the rate R of vehicular involvement in traffic accidents per 100 000 000 vehicle miles as a function of vehicular speed
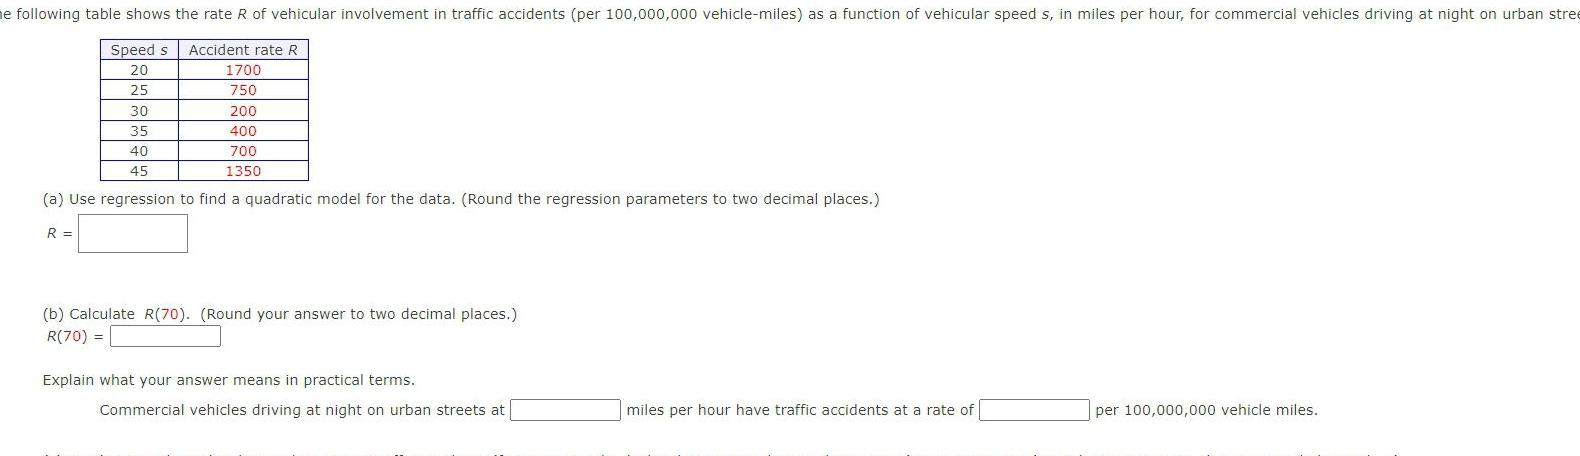

he following table shows the rate R of vehicular involvement in traffic accidents per 100 000 000 vehicle miles as a function of vehicular speed s in miles per hour for commercial vehicles driving at night on urban stree Accident rate R 1700 750 Speed s 20 25 30 200 35 400 40 700 45 1350 a Use regression to find a quadratic model for the data Round the regression parameters to two decimal places R b Calculate R 70 Round your answer to two decimal places R 70 Explain what your answer means in practical terms Commercial vehicles driving at night on urban streets at miles per hour have traffic accidents at a rate of per 100 000 000 vehicle miles
Step by Step Solution
There are 3 Steps involved in it
Step: 1

Get Instant Access to Expert-Tailored Solutions
See step-by-step solutions with expert insights and AI powered tools for academic success
Step: 2

Step: 3
Ace Your Homework with AI
Get the answers you need in no time with our AI-driven, step-by-step assistance
Get Started
Discrete Mathematics Elementary And Beyond
Authors: L Lovasz, J Pelikan, K L Vesztergombi
1st Edition
6610010021, 9786610010028