Answered step by step
Verified Expert Solution
Link Copied!

Question

1 Approved Answer

he: Scatter Plot (Statistics) . following table contains data showing the number of hotdogs sold at a game dependent on the number or fans ending
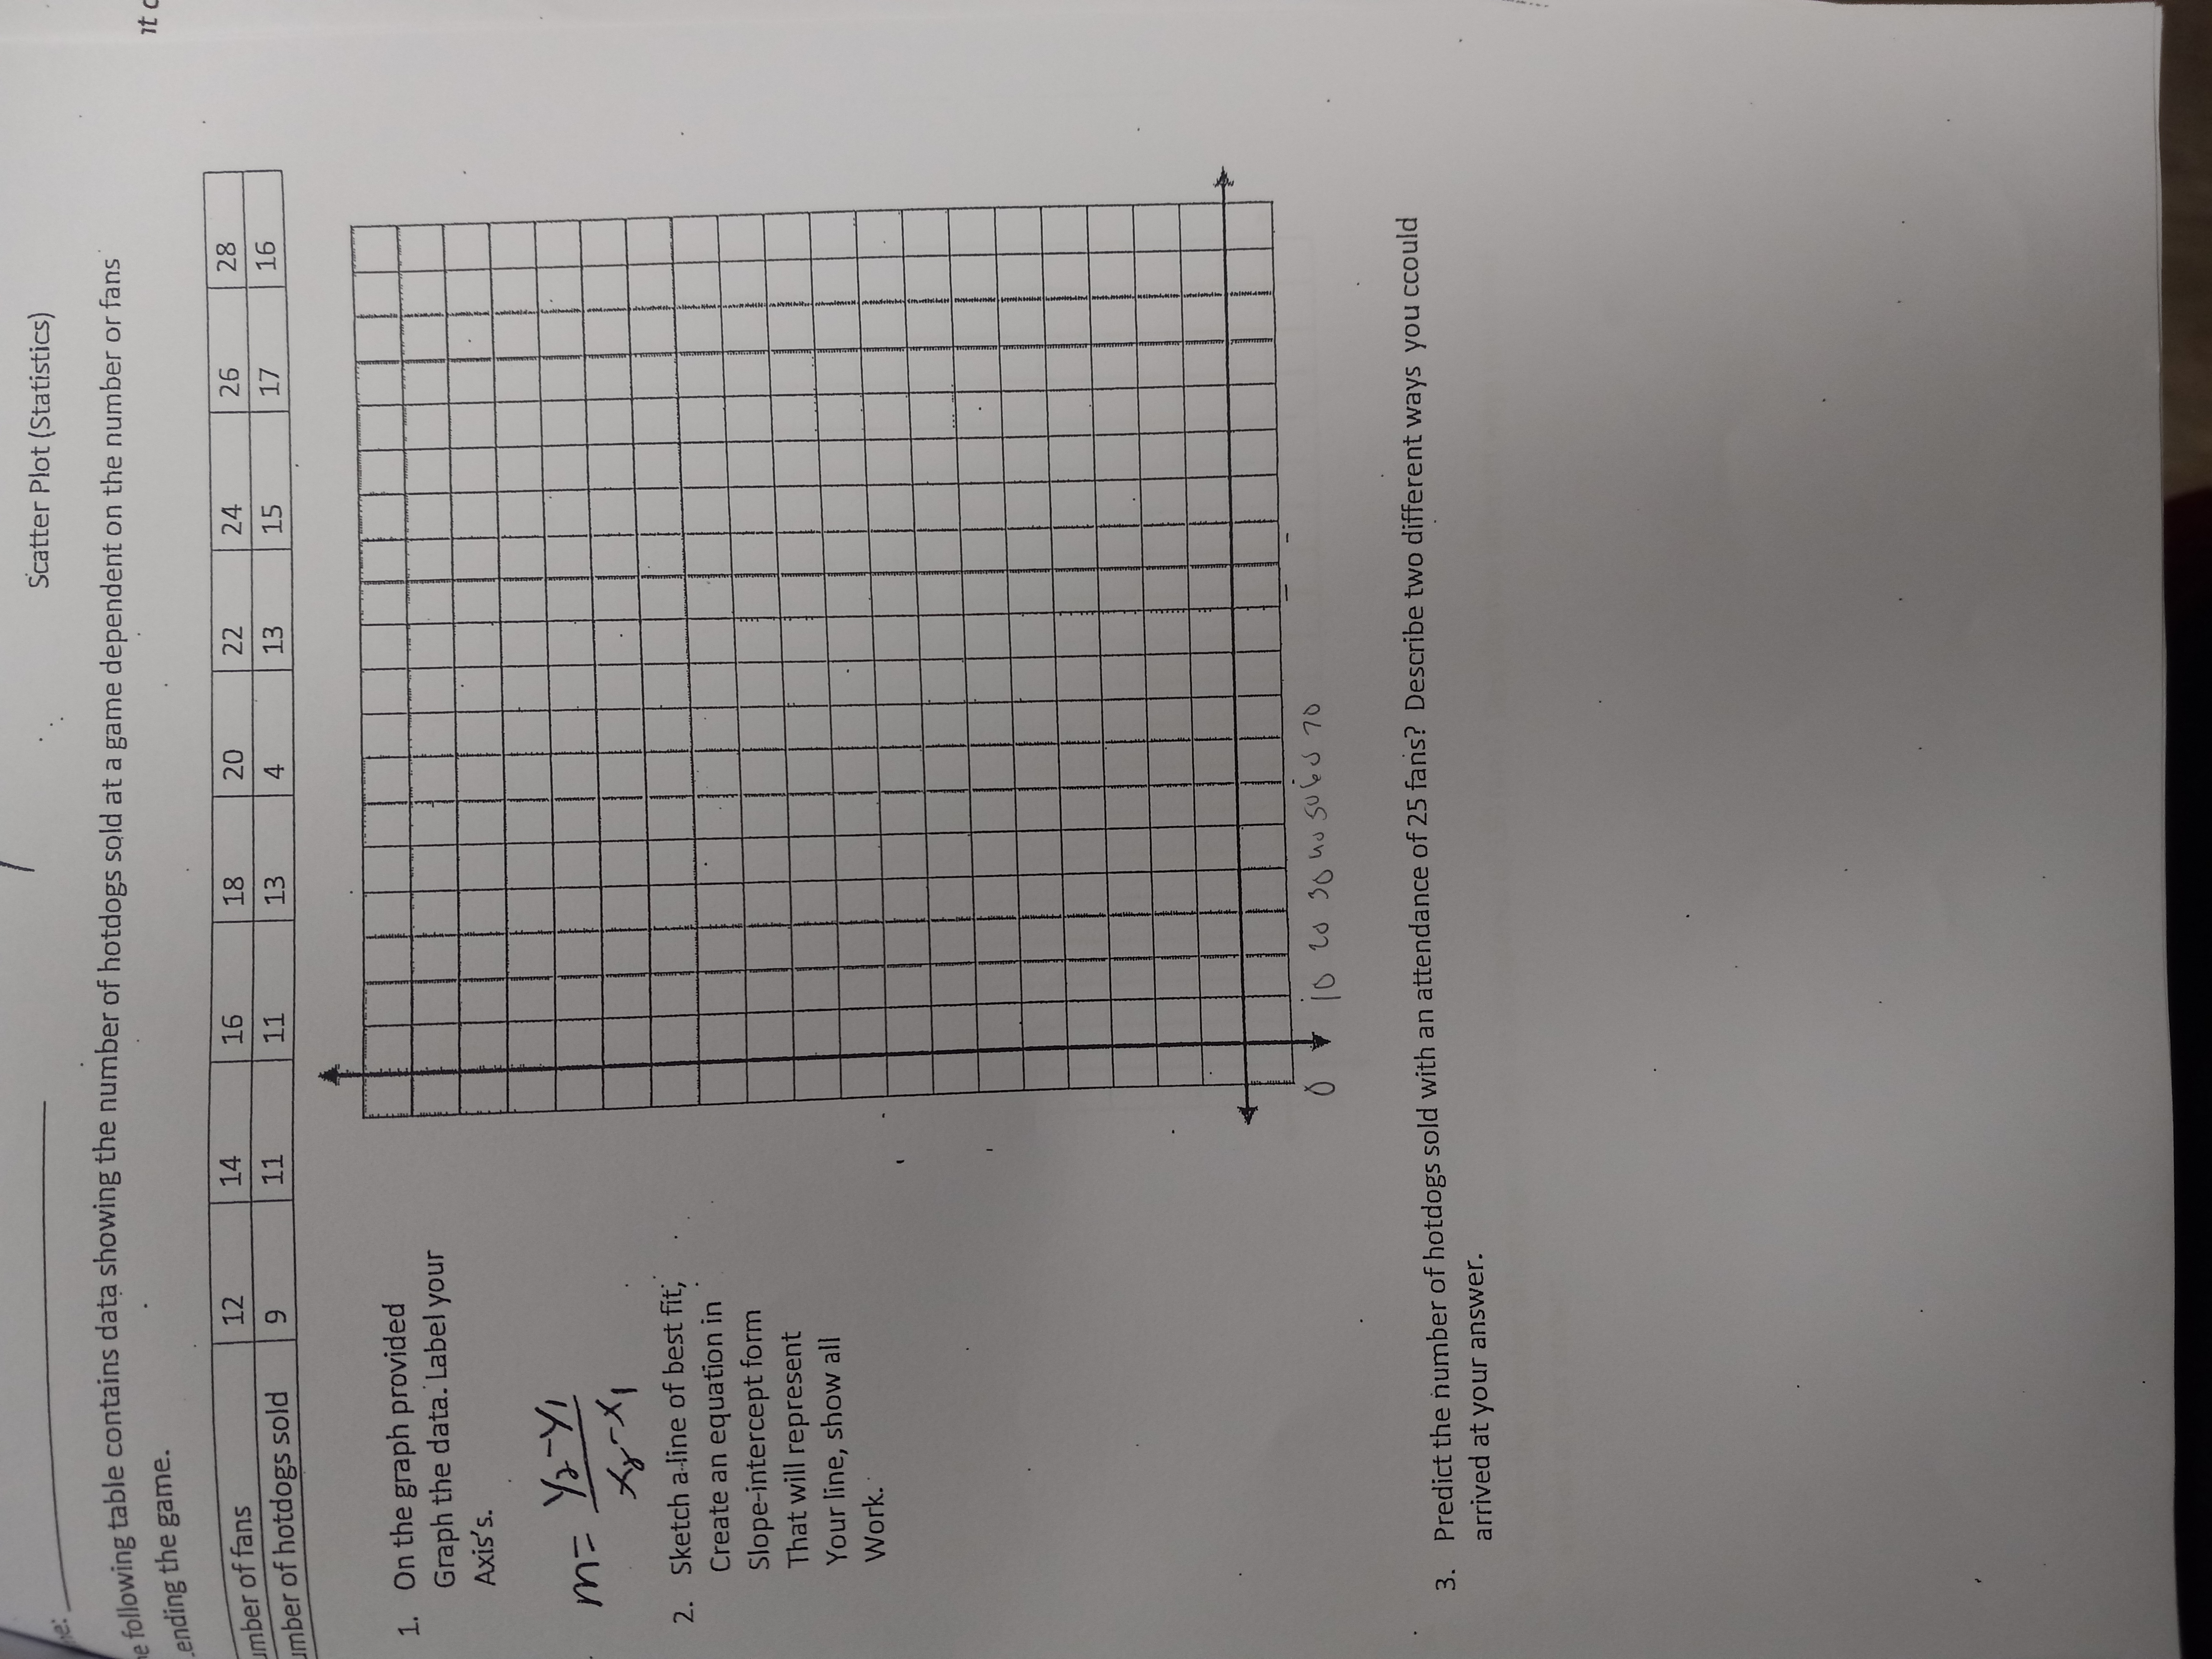
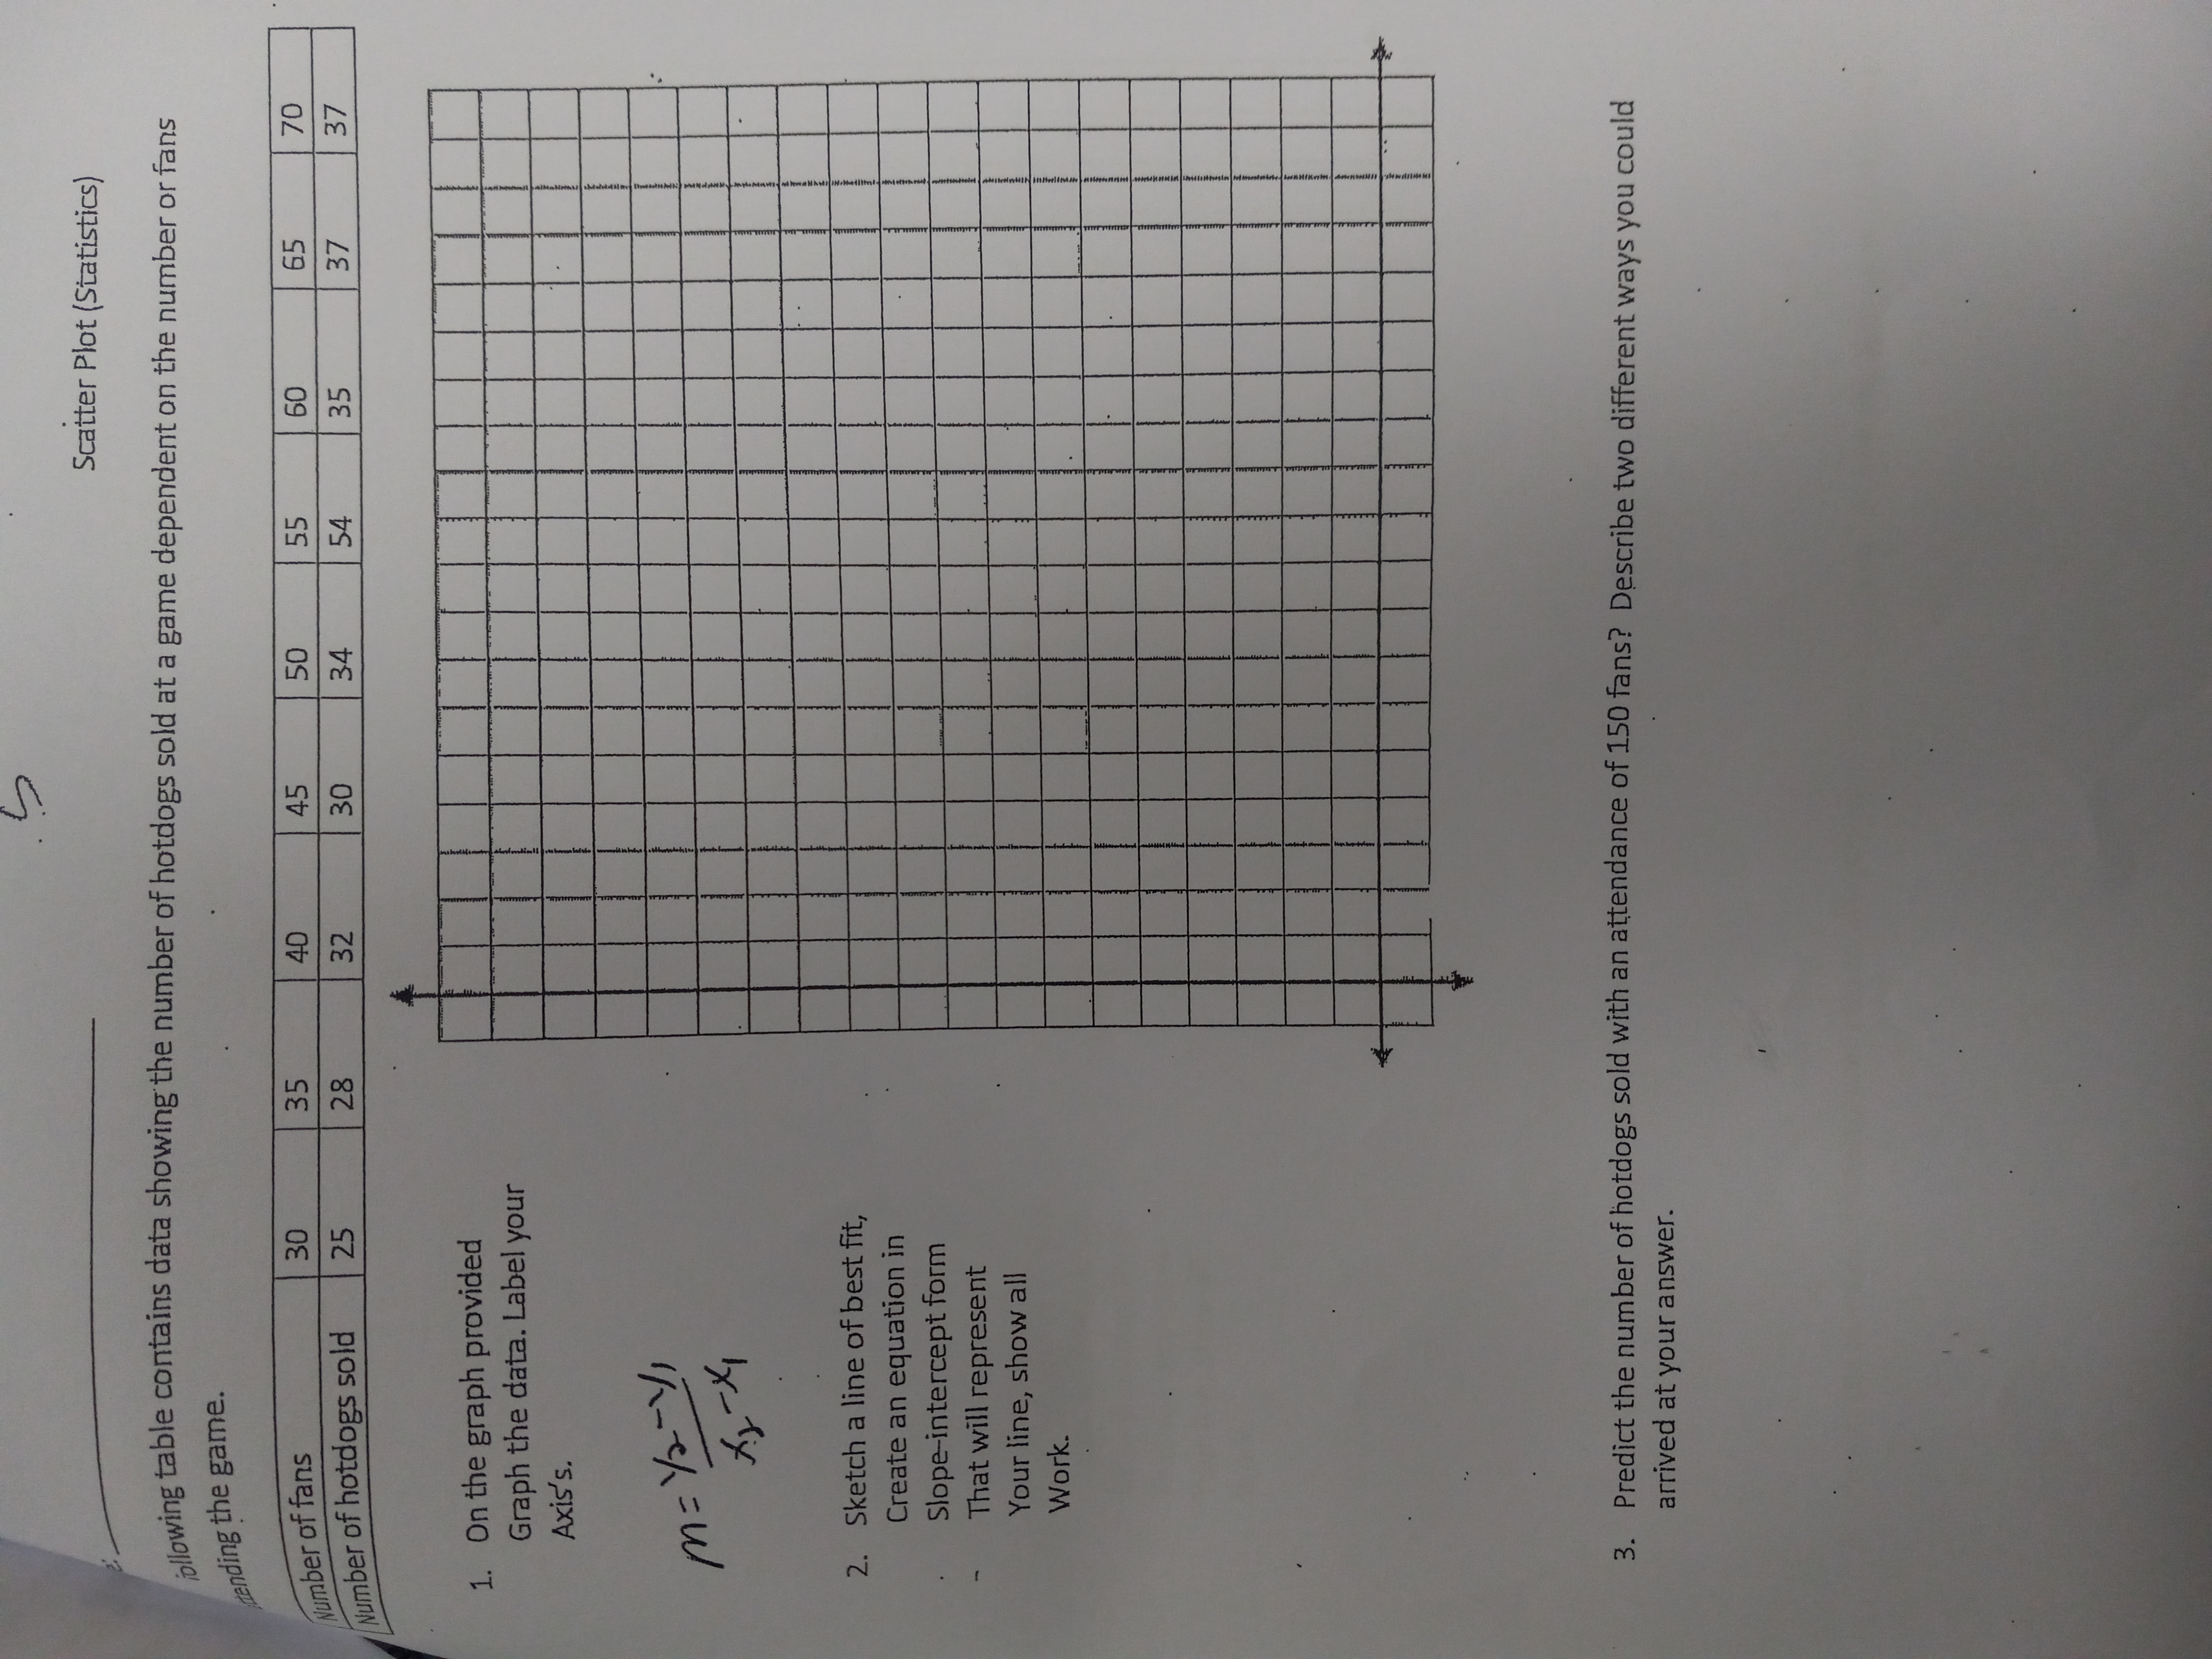
image text in transcribedimage text in transcribed
he: Scatter Plot (Statistics) . following table contains data showing the number of hotdogs sold at a game dependent on the number or fans ending the game. it umber of fans 12 14 16 18 20 22 Imber of hotdogs sold 9 11 24 11 26 28 13 4 13 15 17 16 1. On the graph provided Graph the data. Label your Axis's . m= Yay ! Ly - * 1 2. Sketch a line of best fit; Create an equation in Slope-intercept form That will represent Your line, show all Work. 10 20 30 no subs 70 3. Predict the number of hotdogs sold with an attendance of 25 fans? Describe two different ways you ccould arrived at your answer.Scatter Plot (Statistics) allowing table contains data showing the number of hotdogs sold at a game dependent on the number or fans pending the game. Number of fans 30 35 40 45 50 55 60 65 70 Number of hotdogs sold 25 28 32 30 34 54 35 37 37 1. On the graph provided Graph the data. Label your Axis's . m= 1/ 2 - y, 2. Sketch a line of best fit, Create an equation in Slope intercept form That will represent Your line, show all Work. 3. Predict the number of hotdogs sold with an attendance of 150 fans? Describe two different ways you could arrived at your

Step by Step Solution

There are 3 Steps involved in it

Step: 1

blur-text-image

Get Instant Access to Expert-Tailored Solutions

See step-by-step solutions with expert insights and AI powered tools for academic success

Step: 2

blur-text-image

Step: 3

blur-text-image

Ace Your Homework with AI

Get the answers you need in no time with our AI-driven, step-by-step assistance

Get Started

Recommended Textbook for

Precalculus

Authors: Michael Sullivan

9th edition

321716835, 321716833, 978-0321716835

More Books

Students also viewed these Mathematics questions