

Answered step by step
Verified Expert Solution
Question
1 Approved Answer
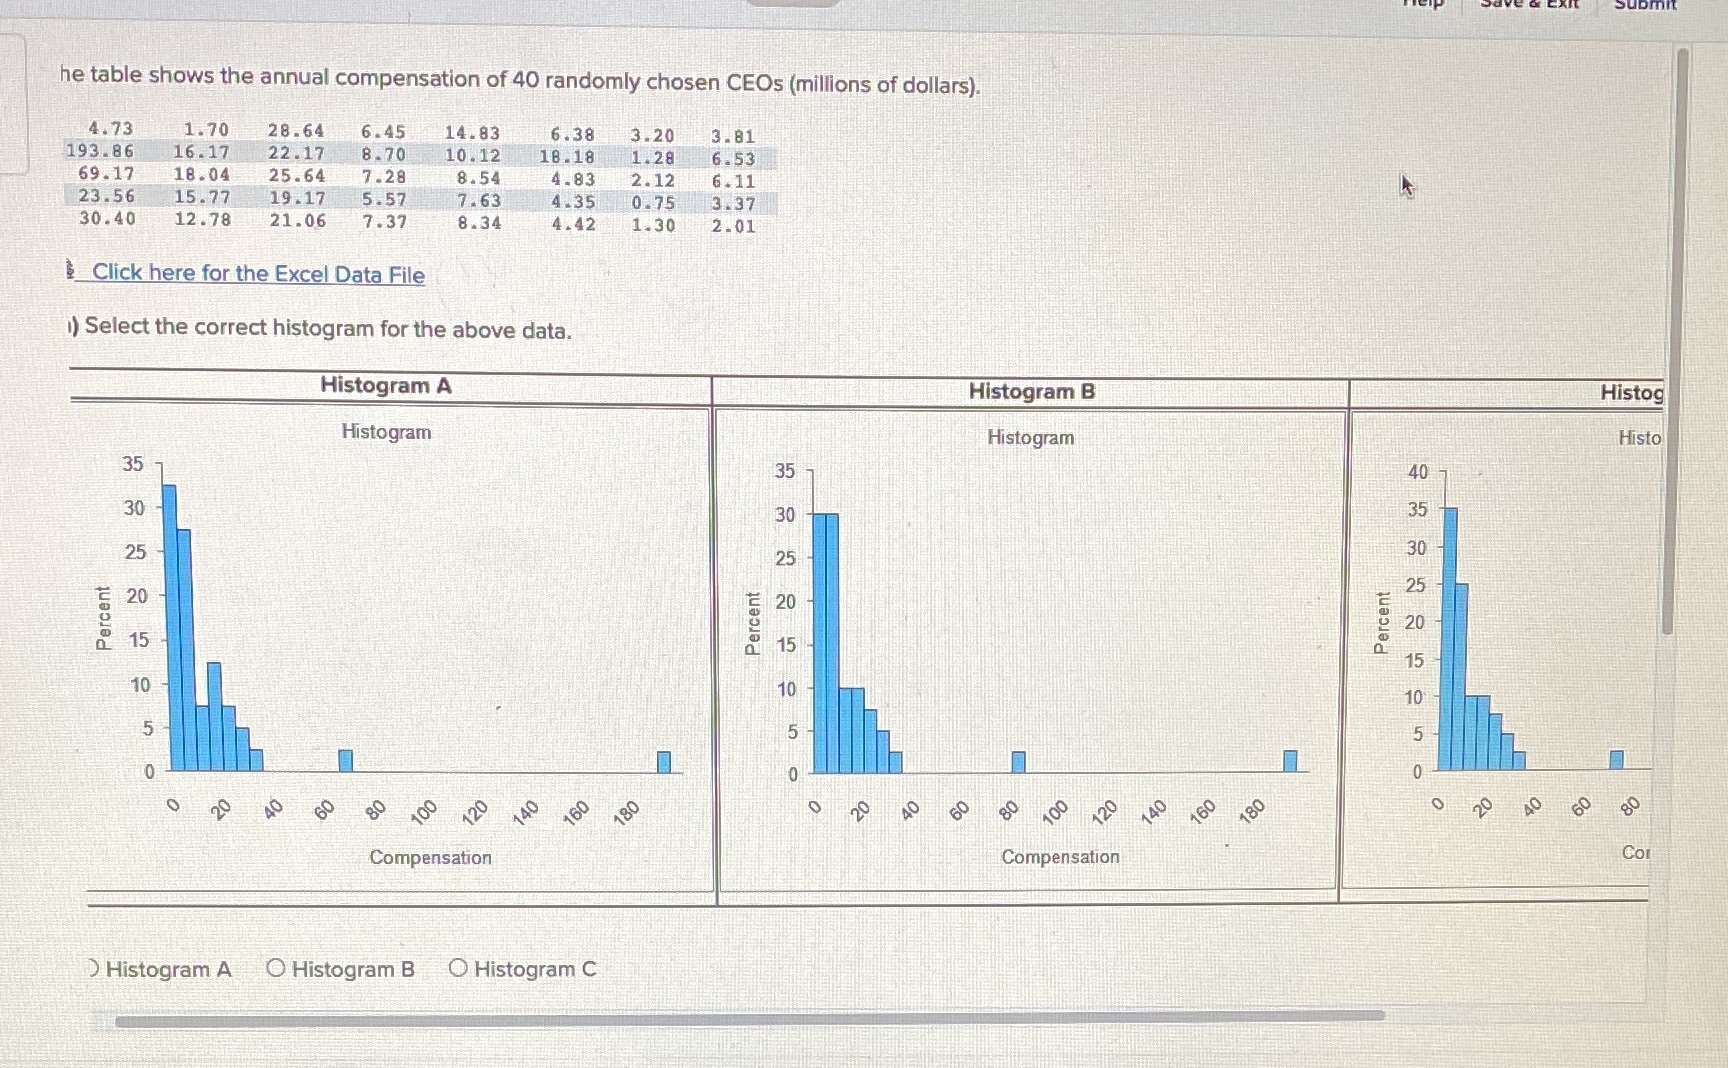
he table shows the annual compensation of 40 randomly chosen CEOs (millions of dollars). 4.73 1. 70 28.64 6.45 14.83 6.38 3.20 3 . 81
Step by Step Solution
There are 3 Steps involved in it
Step: 1

Get Instant Access to Expert-Tailored Solutions
See step-by-step solutions with expert insights and AI powered tools for academic success
Step: 2

Step: 3
Ace Your Homework with AI
Get the answers you need in no time with our AI-driven, step-by-step assistance
Get Started
Combinatorial Geometry In The Plane
Authors: Hugo Hadwiger, Hans Debrunner, Victor Klee
1st Edition
048679993X, 9780486799933