

Answered step by step
Verified Expert Solution
Question
1 Approved Answer
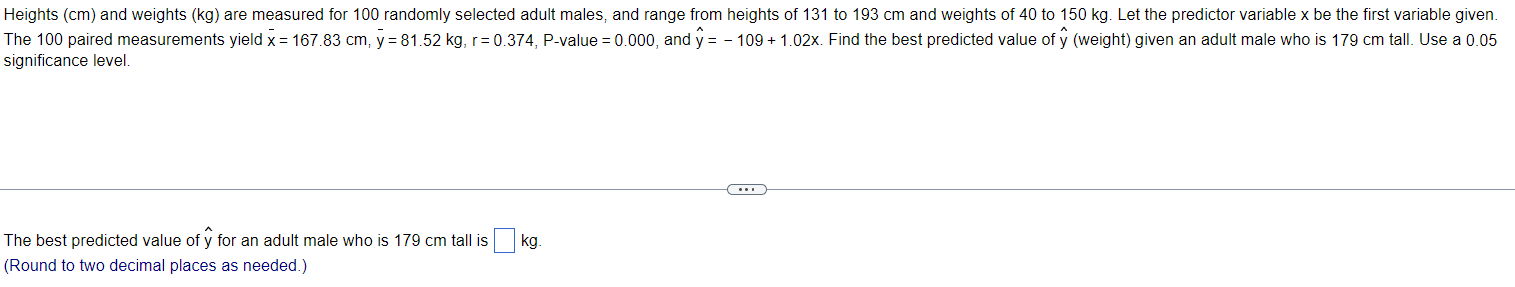
Heights (cm) and weights (kg) are measured for 100 randomly selected adult males, and range from heights of 131 to 193 cm and weights of


Step by Step Solution
There are 3 Steps involved in it
Step: 1

Get Instant Access to Expert-Tailored Solutions
See step-by-step solutions with expert insights and AI powered tools for academic success
Step: 2

Step: 3
Ace Your Homework with AI
Get the answers you need in no time with our AI-driven, step-by-step assistance
Get Started
Calculus Single Variable
Authors: Howard Anton, Irl C Bivens, Stephen Davis
11th Edition
1118885686, 9781118885680