

Question
Hello, below is my code for a linear regression model using Python. I am trying to include 2 thetas using the gradient descent function and
Hello, below is my code for a linear regression model using Python. I am trying to include 2 thetas using the gradient descent function and plot the graph of the optimized slope and points. I have included the graph that my code currently outputs, but the slope and points do not align. If someone could help me rewrite this code to include both thetas and optimized slope and points, I would appreciate it. Thank You.
from sklearn.datasets import load_diabetes
from sklearn.metrics import mean_squared_error
import numpy as np
# Load the diabetes dataset
diabetes = load_diabetes()
x = diabetes.data
y = diabetes.target
#Expand and verify the data shape
y = np.expand_dims(y, 1)
data = np.append(x, y, 1)
#Random Shuffle
np.random.shuffle(data)
#Split Method
total_sample = len(data)
train = data[:int(total_sample*0.7)]
dev= data[int(total_sample*0.7):int(total_sample*0.85)]
test = data[int(total_sample*0.85):]
#Verify Features and Labels
def get_features_and_labels(data):
features = data[:, :-1]
labels = data[:, -1]
return features, labels
train_x, train_y = get_features_and_labels(train)
dev_x, dev_y = get_features_and_labels(dev)
test_x, test_y = get_features_and_labels(test)
# Define the gradient descent function
def gradient_descent(X, y, alpha, num_iters):
m = len(y)
theta = np.zeros((X.shape[1], 1))
for i in range(num_iters):
y_pred = X @ theta
theta -= (alpha / m) * (X.T @ (y_pred - y.reshape(-1, 1)))
return theta
# Define the cost function
def cost_function(X, y, theta):
m = y.shape[0]
y_pred = X @ theta
J = (1 / (2 * m)) * np.dot((y_pred - y.reshape(-1, 1)).T, y_pred - y.reshape(-1, 1))
return J
# Train and evaluate 10 univariate linear regression models, one for each feature
best_mse = float('inf')
best_theta = None
best_feature = None
for feature in range(train_x.shape[1]):
X = train_x[:, [feature]]
alpha = 0.01
num_iters = 1000
theta = gradient_descent(X, train_y, alpha, num_iters)
predictions = dev_x[:, feature].reshape(-1, 1) @ theta
mse = mean_squared_error(dev_y, predictions)
if mse
best_mse = mse
best_theta = theta
best_feature = feature
import matplotlib.pyplot as plt
# Plot the data and the regression line for the best feature
X = train_x[:, best_feature].reshape(-1, 1)
Y = train_y
plt.scatter(X, Y)
plt.plot(X, X @ best_theta, color='red')
plt.xlabel('Feature {}'.format(best_feature))
plt.ylabel('Target')
plt.show()
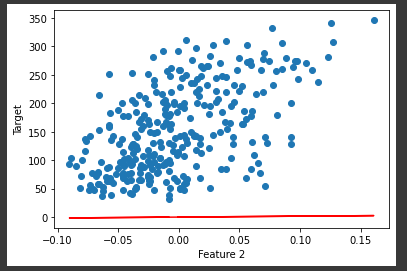
Feature 2
Step by Step Solution
There are 3 Steps involved in it
Step: 1

Get Instant Access to Expert-Tailored Solutions
See step-by-step solutions with expert insights and AI powered tools for academic success
Step: 2

Step: 3
Ace Your Homework with AI
Get the answers you need in no time with our AI-driven, step-by-step assistance
Get Started
Sql Data Analytics Made Easy Your Step By Step Guide To Unlocking Datas Hidden Secrets Demystify Complex Concepts And Harness The Power Of Data To Drive Intelligent Decision Making Effortlessly
Authors: L D Knowings
1st Edition
B0CKHWZ35K, 979-8862830880